Millersburg: Fire Incidents, Pennsylvania (PA)
Where are fire incidents reported in Millersburg, PA
Something went wrong! Please refresh the page.
|
| |||||||||||||||||||||||||||||||||||||||||||||||||||||||||||||||||||||||||||||||||||||||||||||||||||||||||||||
2005 - 2018 National Fire Incident Reporting System (NFIRS) incidents
- Incident types reported to NFIRS in Millersburg, PA
- 25647.5%Fire
- 11020.4%Hazardous Condition
- 7513.9%Rescue & EMS
- 468.5%Good Intent Call
- 264.8%Service Call
- 213.9%False Alarm
- 50.9%Special Incident
- Fire incident types reported to NFIRS in Millersburg, PA
- 15660.9%Structure Fires
- 7529.3%Outside Fires
- 187.0%Mobile Property/Vehicle Fires
- 72.7%Other
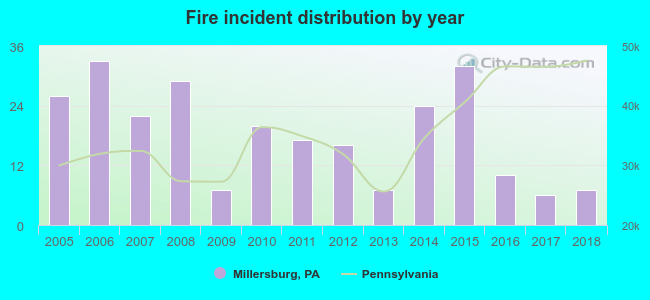 According to the data from the years 2005 - 2018 the average number of fire incidents per year is 18. The highest number of fires - 33 took place in 2006, and the least - 6 in 2017. The data has a dropping trend.
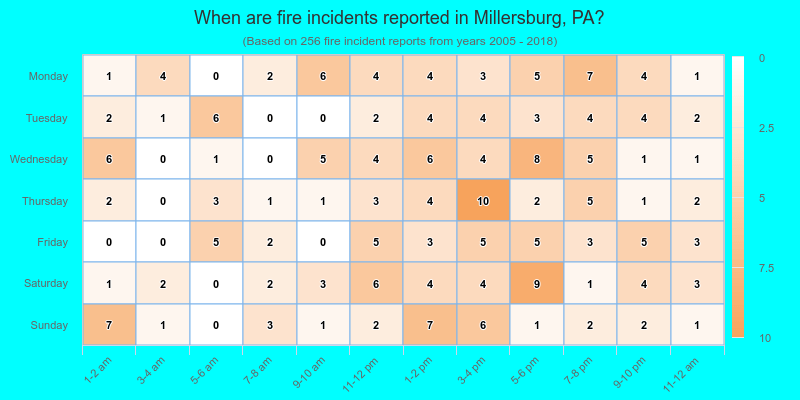
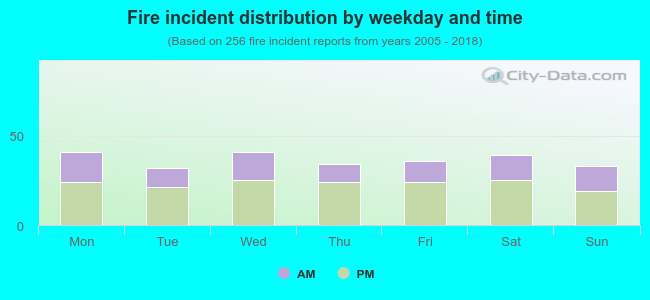 36.7% incidents where reported in the morning and 63.3% in the evening. The most fires (16.0%) took place on Monday, and the least (12.5%) on Tuesday.
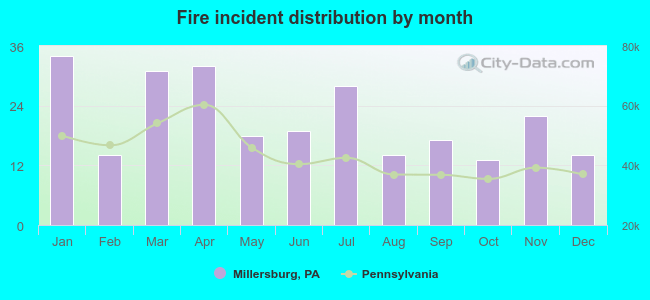 According to the 256 incident reports from years 2005 - 2018 most fires (13.3%) took place during January, and the least (5.1%) in October.
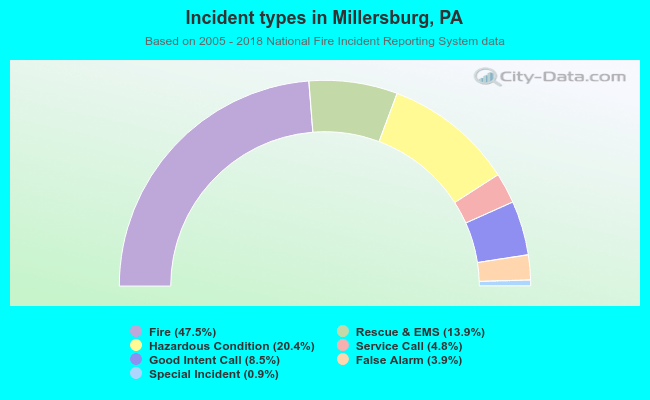 Out of all 539 cases reported during the years 2005 - 2018, the most belonged to the categories: Fire (47.5%), Rescue & EMS (20.4%), and Overpressure Rupture (13.9%).
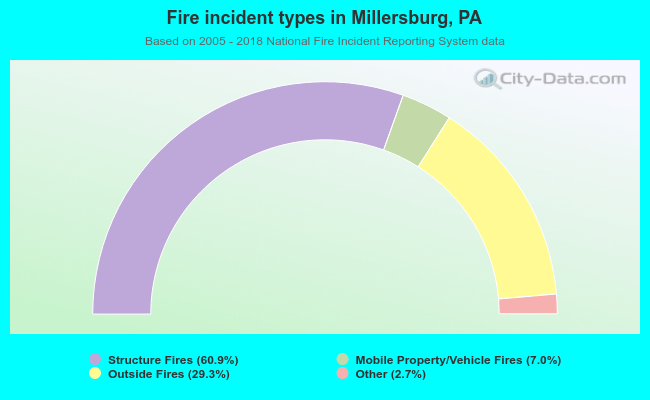 When looking into fire subcategories, the most reports belonged to: Structure Fires (60.9%), and Outside Fires (29.3%).