| Fire incidents reported |
|---|
| Sreet name | Count |
|---|
| ROBIN RD | 18 | | CLARK RD | 16 | | SHANNON RT | 16 | | EAGLE POINT RD | 12 | | MAIN ST | 12 | | OGLE RD | 12 | | BARCLAY RD | 10 | | MAIN AVE | 10 | | 1ST ST | 8 | | SUNSHINE RD | 8 | | 230 MAIN AVE | 6 | | COCHRAN AVE | 6 | | COLETA RD | 6 | | FAIRHAVEN RD | 6 | | IDEAL RD | 6 | | LIVENGOOD | 6 | | OTTER CREEK DR | 6 | | PATTERSON RD | 6 | | 31134 EAGLE POINT RD | 4 | | 424 MAIN AVE | 4 | | ELKHORN RD | 4 | | FIFTH ST | 4 | | GRANDVIEW RD | 4 | | MILLEDGEVILLE RD | 4 | | OGLE AND MILLEDGEVILLE RD | 4 |
| | | Fire incidents reported |
|---|
| Sreet name | Count |
|---|
| OTTER CREEK | 4 | | ROBIN | 4 | | ROUTE 40 | 4 | | STOVER AVE | 4 | | WASHINGTON | 4 | | 1 EAST 6TH ST | 2 | | 1 EAST OLD MILL ST | 2 | | 1185 OTTER CREEK DRIVE | 2 | | 1185 OTTER CREEK DRIVE RD | 2 | | 14 S WASHINGTON | 2 | | 14 S WASHINGTON ST | 2 | | 15 W 4TH ST | 2 | | 15 W. 4TH ST | 2 | | 17553 BARCLAY RD | 2 | | 17553 BARCLAY RD | 2 | | 18 WEST 5 TH ST | 2 | | 18634 LUTHER RD. RD | 2 | | 19730 DEAN RD | 2 | | 2 EAST 1ST ST | 2 | | 202 WASHINGTON | 2 | | 21356 LUTHER RD. | 2 | | 2138 SOUTH OGLE RD | 2 | | 214 5TH STREET ST | 2 | | 21410 PENROSE RD | 2 | | |
|
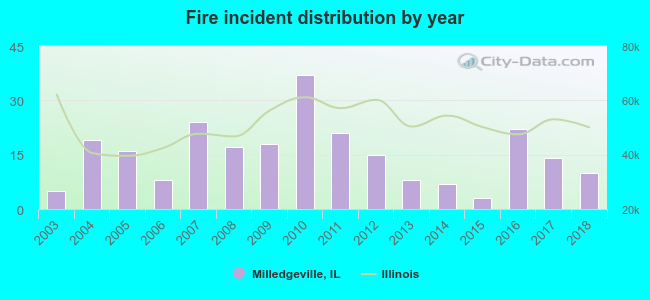 Based on the data from the years 2003 - 2018 the average number of fires per year is 15. The highest number of fires - 37 took place in 2010, and the least - 3 in 2015. The data has a rising trend.
 38.1% incidents where reported in the morning and 61.9% in the evening. The most fires (20.9%) took place on Saturday, and the least (9.0%) on Tuesday.
 Based on the 244 fire incident reports from years 2003 - 2018 most fires (19.3%) took place during September, and the least (2.0%) in August.
 Out of all 419 cases reported during the years 2003 - 2018, the most belonged to the categories: Fire (58.2%), Rescue & EMS (21.0%), and False Alarm (6.4%).
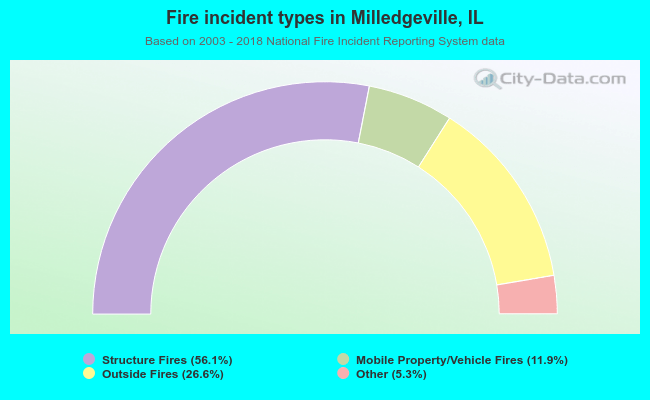 When looking into fire subcategories, the most incidents belonged to: Structure Fires (56.1%), and Outside Fires (26.6%).