| Fire incidents reported |
|---|
| Sreet name | Count |
|---|
| I 84 HWY | 16 | | RAYMONDSKILL RD | 12 | | BROAD ST | 10 | | FOSTER HILL RD | 10 | | HARFORD ST | 8 | | WEST CATHARINE ST | 8 | | SAWKILL RD | 6 | | 2325 MILL STA. 57 RD | 4 | | 6 RT | 4 | | 6AND209 RT | 4 | | BRIDGE ST | 4 | | BUTTERCUP TER | 4 | | HIGH ST | 4 | | INTERSTATE 84 | 4 | | LAKEWOOD DR | 4 | | MILLER RD | 4 | | MOON VALLEY RD | 4 | | MOUNT JOY RD | 4 | | OWEGO TPKE | 4 | | ROUTE 6 RT | 4 | | SECOND ST | 4 | | SENECA DR | 4 | | UPPER RIDGE RD | 4 | | YELLOW WOOD DR | 4 | | 158 SAWKILL RD | 2 |
| | | Fire incidents reported |
|---|
| Sreet name | Count |
|---|
| 209 WILD MEADOW | 2 | | 22856 RT 35S | 2 | | 6 AND 209 RT | 2 | | 6209 RT | 2 | | ANN ST | 2 | | BLUEBERRY DR | 2 | | BRIDGE RD | 2 | | BROAD ST | 2 | | BUIEST RD | 2 | | CATHERINE ST | 2 | | CHIPPY COLE RD | 2 | | CHRISTIAN HILL RD | 2 | | CLIFF PARK RD | 2 | | CORNELIA LN | 2 | | CRANBERRY LN | 2 | | CREEK VIEW DR | 2 | | DEEP BROOK RD | 2 | | DWARFSKILL FALLS LN | 2 | | EVERGREEN LN | 2 | | FIRE TOWER RD | 2 | | FRENCH TOWN RD | 2 | | FRENCHTOWN RD | 2 | | FRENCHTOWN RD | 2 | | FRENCHTOWN ROAD HWY | 2 | | |
|
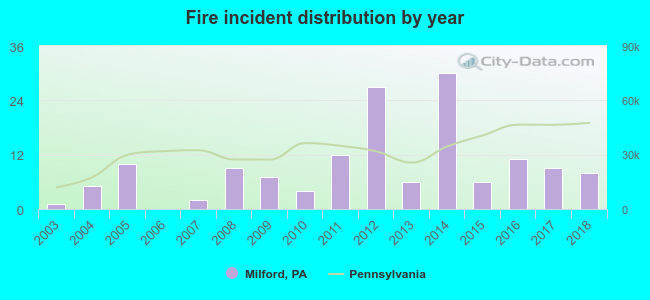 According to the data from the years 2003 - 2018 the average number of fire incidents per year is 9. The highest number of fires - 30 took place in 2014, and the least - 0 in 2006. The data has a growing trend.
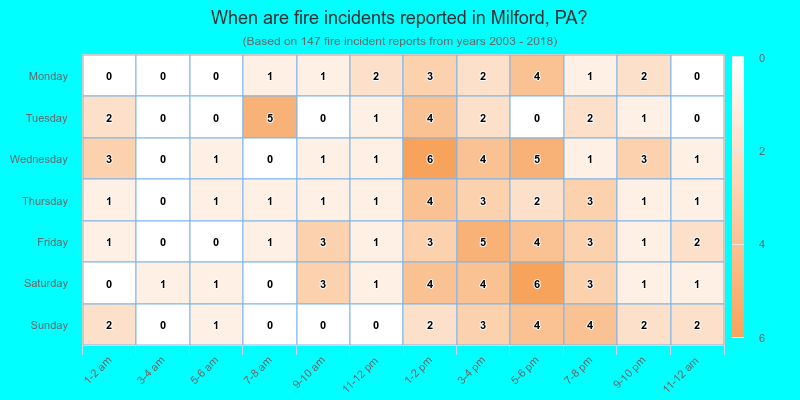
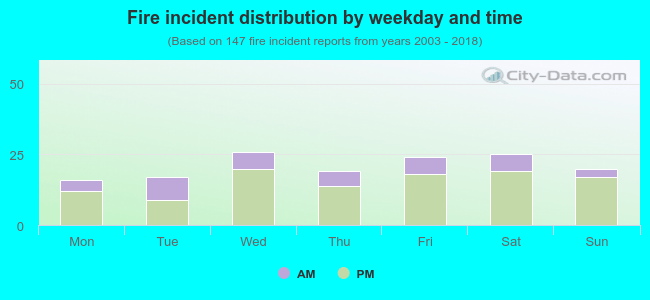 25.9% incidents where reported in the morning and 74.1% in the evening. The most fires (17.7%) took place on Wednesday, and the least (10.9%) on Monday.
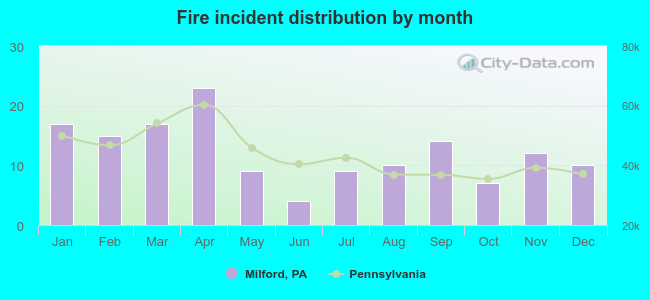 According to the 147 incident reports from years 2003 - 2018 most fires (15.6%) took place during April, and the least (2.7%) in June.
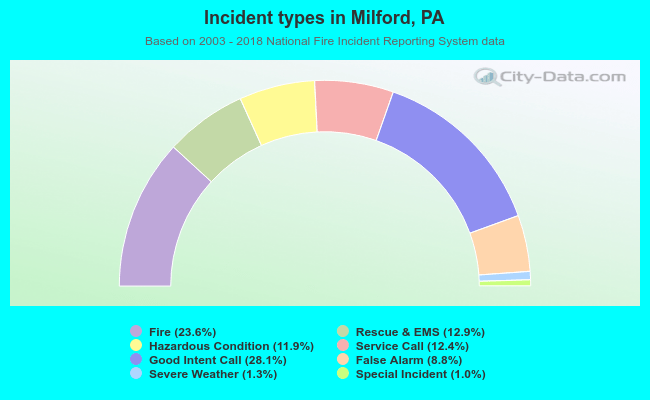 Out of all 622 cases reported during the years 2003 - 2018, the most belonged to the categories: Service Call (28.1%), Fire (23.6%), and Overpressure Rupture (12.9%).
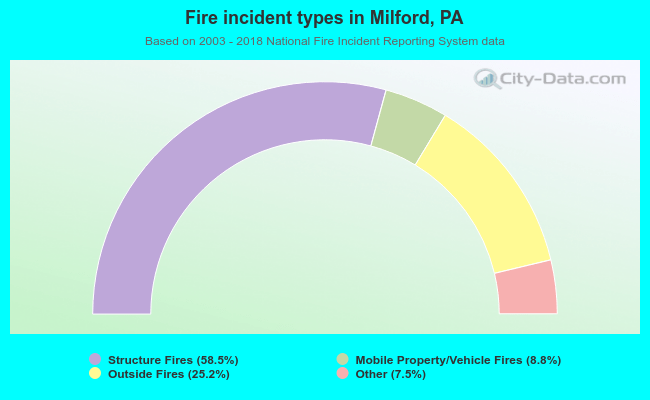 When looking into fire subcategories, the most reports belonged to: Structure Fires (58.5%), and Outside Fires (25.2%).