| Fire incidents reported |
|---|
| Sreet name | Count |
|---|
| WILLIAM PENN HWY | 22 | | WILLIAM PENN HWY | 20 | | 35 NORTH | 14 | | RED ROCK RD | 14 | | DOE RUN RD | 12 | | RED ROCK RD | 10 | | STATION 2 | 10 | | CEDAR GROVE RD | 8 | | ENERGEX DR | 8 | | RESERVOIR RD | 8 | | US 322 | 8 | | WALKER | 8 | | CEDAR SPRINGS RD | 6 | | FOSTER ST | 6 | | MAIN ST | 6 | | ROUTE 35 | 6 | | RT 322 RT | 6 | | WASHINGTON AVE | 6 | | 453 HORNINGTOWN RD | 4 | | ABUNDANT BLESSING DR | 4 | | BUTCHER SHOP RD | 4 | | CEDAR SPRINGS ROAD | 4 | | CLECK RD | 4 | | CONARD LN | 4 | | CUBA MILLS RD | 4 |
| | | Fire incidents reported |
|---|
| Sreet name | Count |
|---|
| ENTER SEARCH TEXT HERE | 4 | | INDUSTRIAL DR | 4 | | JUNIATA COUNTY | 4 | | LICKING CREEK ROAD | 4 | | LONG RD | 4 | | MAIN ST | 4 | | MUDDY RUN ROAD | 4 | | N THIRD ST | 4 | | NELSON RD | 4 | | NELSON ROAD | 4 | | NORTH ST | 4 | | ORE DR | 4 | | SHADE RD | 4 | | SONAR LN | 4 | | SR-35 | 4 | | TEXAS HOLLOW RD | 4 | | US HIGHWAY 322 | 4 | | WILLIAM PENN HIGHWAY | 4 | | ZENDT HOLLOW RD | 4 | | 105 N ST MANOR | 2 | | 1071 WILLIAM PENN HWY | 2 | | 1077 ARCH ROCK RD | 2 | | 1083 WILLIAM PENN HWY | 2 | | 111 MAIN ST | 2 | | 12595 RT322 WEST | 2 |
|
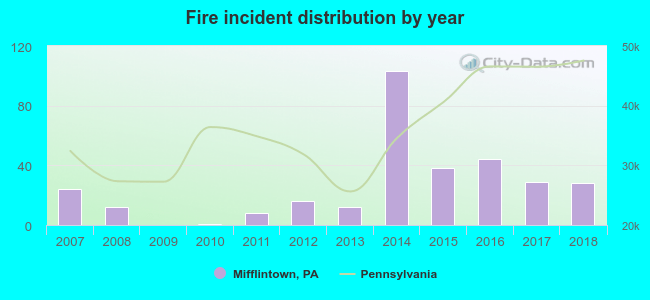 According to the data from the years 2007 - 2018 the average number of fire incidents per year is 26. The highest number of fires - 103 took place in 2014, and the least - 0 in 2009. The data has a growing trend.
 36.8% incidents where reported in the morning and 63.2% in the evening. The most fires (16.5%) took place on Saturday, and the least (10.8%) on Wednesday.
 According to the 315 incident reports from years 2007 - 2018 most fires (14.0%) took place during April, and the least (3.8%) in June.
 Out of all 752 cases reported during the years 2007 - 2018, the most belonged to the categories: Fire (41.9%), Service Call (20.6%), and Overpressure Rupture (19.8%).
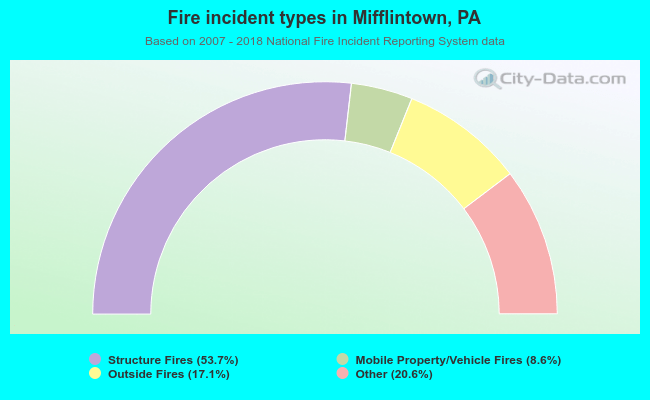 When looking into fire subcategories, the most reports belonged to: Structure Fires (53.7%), and Other (20.6%).