| Fire incidents reported |
|---|
| Sreet name | Count |
|---|
| 35 SOUTH | 12 | | MAIN ST | 12 | | 333 RT | 10 | | LICKING CREEK RD | 10 | | MILFORD | 10 | | ROUTE 35 RT | 10 | | JUNIATA ST | 8 | | MOWERY ST | 8 | | 102 FOSTER ST | 6 | | TUSCARORA ST | 6 | | 203 MOWERY ST | 4 | | 208 JUNIATA ST | 4 | | MUDDY RUN RD | 4 | | RT 35 S | 4 | | SR-35 | 4 | | TUSCARORA STREET | 4 | | 1 MAIN ST | 2 | | 106 LONG VIEW DR | 2 | | 109 FOSTER ST | 2 | | 110 MAIN ST | 2 | | 111 PATH STREET | 2 | | 111 PTH ST | 2 | | 11149 LICKING CREEK RD | 2 | | 11342 LICKING CREEK | 2 | | 115 ORCHARD HILL | 2 |
| | | Fire incidents reported |
|---|
| Sreet name | Count |
|---|
| 15006 RT 35 S | 2 | | 18 MAIN ST | 2 | | 2051 CIDER PRESS RD | 2 | | 22768 RT35 S | 2 | | 25 MUDDY RUN RD | 2 | | 26 MAIN ST | 2 | | 2780 RHINE HOLLOW RD | 2 | | 317 LICKING CREEK RD | 2 | | 3461 RT 333 | 2 | | 35 SOUTH MIFFLIN | 2 | | 3621 SR 333 | 2 | | 369 LICKING CREEK RD | 2 | | 4657 MCCOYSVILLE RD | 2 | | 479 HERRING BONE RD | 2 | | 5274 RT 333 | 2 | | 6 MAIN ST | 2 | | 6433 LICKING CREEK RD | 2 | | 672 RIVER RD | 2 | | 69 COTTAGE RD | 2 | | 7678 LICKING CREEK RD | 2 | | 88 MILFORD ST | 2 | | CASNER LN | 2 | | CITY HOOK AND LADDER | 2 | | COTTAGE RD | 2 | | |
|
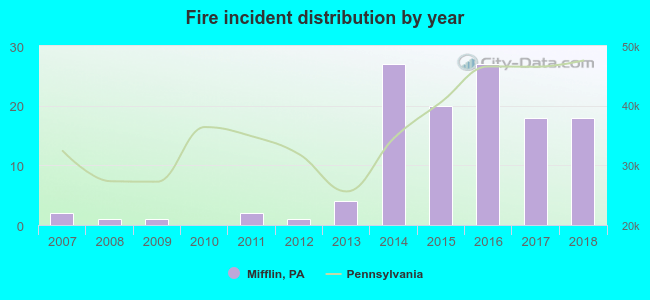 Based on the data from the years 2007 - 2018 the average number of fires per year is 10. The highest number of fire incidents - 27 took place in 2014, and the least - 0 in 2010. The data has an increasing trend.
 38.8% incidents where reported in the morning and 61.2% in the evening. The most fires (19.8%) took place on Friday, and the least (6.6%) on Thursday.
 Based on the 121 fire incidents from years 2007 - 2018 most fires (22.3%) took place during January, and the least (1.7%) in July.
 Out of all 294 cases reported during the years 2007 - 2018, the most belonged to the categories: Fire (41.2%), Overpressure Rupture (25.2%), and Hazardous Condition (15.6%).
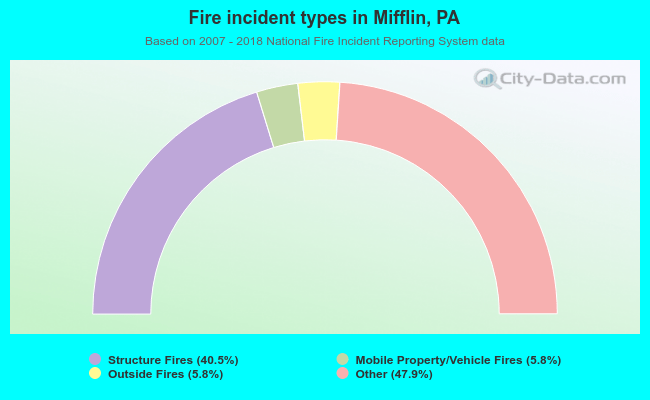 When looking into fire subcategories, the most incidents belonged to: Other (47.9%), and Structure Fires (40.5%).