Midland: Fire Incidents, Arkansas (AR)
Where are fire incidents reported in Midland, AR
Something went wrong! Please refresh the page.
|
| |||||||||||||||||||||||||||||||||||||||||||||||||||||||||||||||||||||||||||||||||||||||||||||||||||||||||||||
2003 - 2018 National Fire Incident Reporting System (NFIRS) incidents
- Incident types reported to NFIRS in Midland, AR
- 16957.5%Fire
- 7826.5%Rescue & EMS
- 165.4%Service Call
- 165.4%Good Intent Call
- 124.1%Hazardous Condition
- 20.7%False Alarm
- 10.3%Severe Weather
- Fire incident types reported to NFIRS in Midland, AR
- 8952.7%Outside Fires
- 6639.1%Structure Fires
- 74.1%Mobile Property/Vehicle Fires
- 74.1%Other
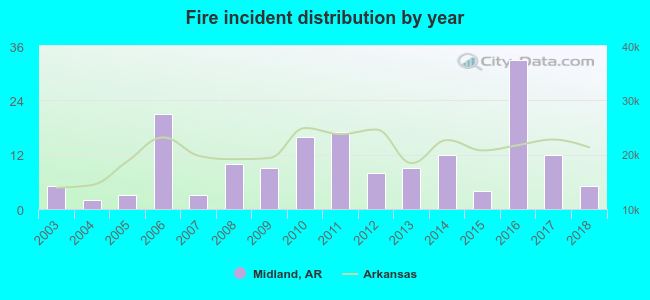 According to the data from the years 2003 - 2018 the average number of fires per year is 11. The highest number of fire incidents - 33 took place in 2016, and the least - 2 in 2004. The data has a constant trend.
 26.6% incidents where reported in the morning and 73.4% in the evening. The most fires (18.9%) took place on Wednesday, and the least (8.3%) on Monday.
 Based on the 169 fire incidents from years 2003 - 2018 most fires (16.6%) took place during January, and the least (2.4%) in October.
 Out of all 294 cases reported during the years 2003 - 2018, the most belonged to the categories: Fire (57.5%), Overpressure Rupture (26.5%), and Hazardous Condition (5.4%).
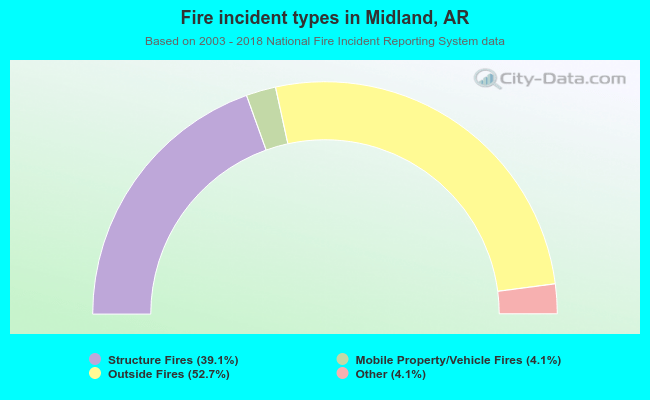 When looking into fire subcategories, the most reports belonged to: Outside Fires (52.7%), and Structure Fires (39.1%).