| Fire incidents reported |
|---|
| Sreet name | Count |
|---|
| WICK RD | 8 | | ELK FORK RD | 6 | | SELLERS ROAD RD | 6 | | STATE RIDGE ROAD | 6 | | TWIN HICKORY ROAD | 6 | | 1018 FREW CIRCLE | 4 | | 130 ORILE DRIVE | 4 | | 372 4H DRIVE | 4 | | ELK FORK | 4 | | ELK FORK RD | 4 | | ELK FORK ROAD | 4 | | KELCH HILL | 4 | | KLONDIKE RD | 4 | | KLONDIKE ROAD | 4 | | LITTLE SANCHO RD | 4 | | MAIN ST | 4 | | MAIN STREET | 4 | | MUDDY CREEK RD. | 4 | | RT 18 | 4 | | TYLER HIGHWAY | 4 | | WICK ROAD | 4 | | WOLFPEN ROAD | 4 | | *3 M ON ELK FK RD OFF RT 180 | 2 | | .5 MI. ONSHOLO RD. | 2 | | 1 AND HALF MILE UP ELK FORK RD | 2 |
| | | Fire incidents reported |
|---|
| Sreet name | Count |
|---|
| 1 MILE NORTH OF MIDDLEBOURNE | 2 | | 1003 MIDDLE ISLAND RD | 2 | | 1003 MIDDLE ISLAND ROAD | 2 | | 10247 TYLER HGW | 2 | | 106 CHESTNUT LANE HADDOX RUN | 2 | | 1069 WICK RD | 2 | | 113 DODD ST | 2 | | 113 DODD STREET | 2 | | 118 MAYFIELD ST | 2 | | 118 MAYFIELD STREET | 2 | | 1201 GORRELLS RUN ROAD | 2 | | 1201 GORRELS RUN RD. | 2 | | 13 KELCH HILL | 2 | | 13 KELCH HILL RD | 2 | | 1330 MCKIM CREEK ROAD | 2 | | 1396 SELLERS ROAD | 2 | | 1396 SELLERS RUN RD | 2 | | 169 YORK SHIRE DRIVE | 2 | | 169 YORKSHIRE DR | 2 | | 175 BRIDGEWAY ROAD | 2 | | 179 TWIN HICKORY ROAD | 2 | | 1970 GOLD RING RD | 2 | | 1970 GOLD RING ROAD | 2 | | 1970 GOLDRING ROAD | 2 | | |
|
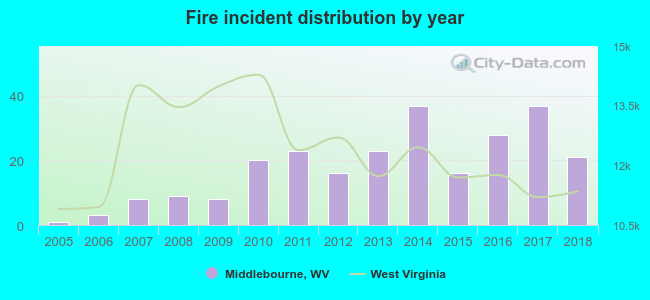 According to the data from the years 2005 - 2018 the average number of fires per year is 18. The highest number of reported fires - 37 took place in 2014, and the least - 1 in 2005. The data has a rising trend.
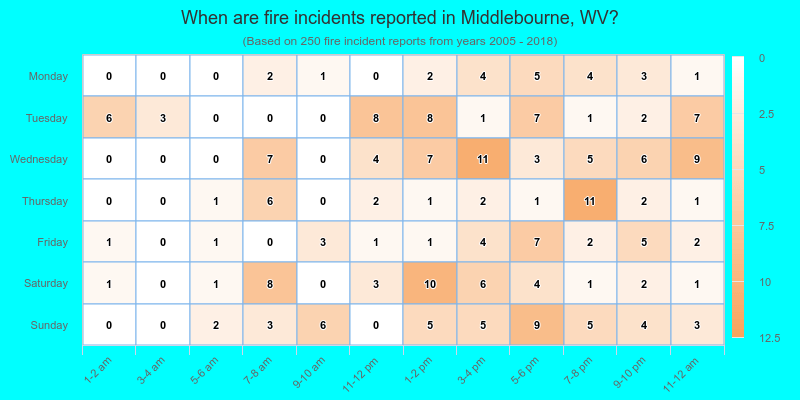
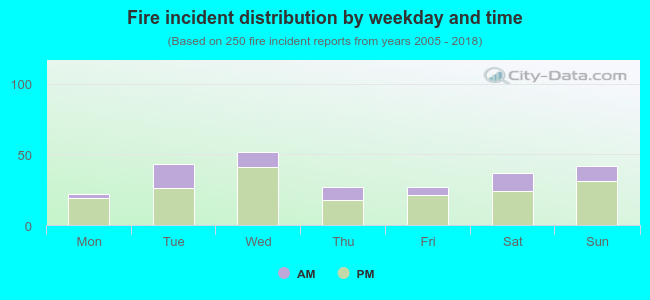 28.0% incidents where reported in the morning and 72.0% in the evening. The most fires (20.8%) took place on Wednesday, and the least (8.8%) on Monday.
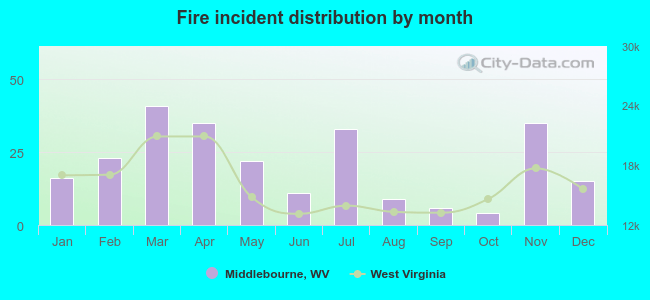 Based on the 250 incident reports from years 2005 - 2018 most fires (16.4%) took place during March, and the least (1.6%) in October.
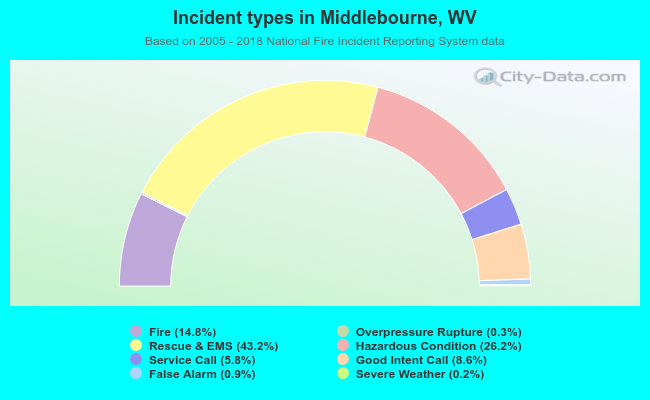 Out of all 1,688 cases reported during the years 2005 - 2018, the most belonged to the categories: Rescue & EMS (43.2%), Hazardous Condition (26.2%), and Fire (14.8%).
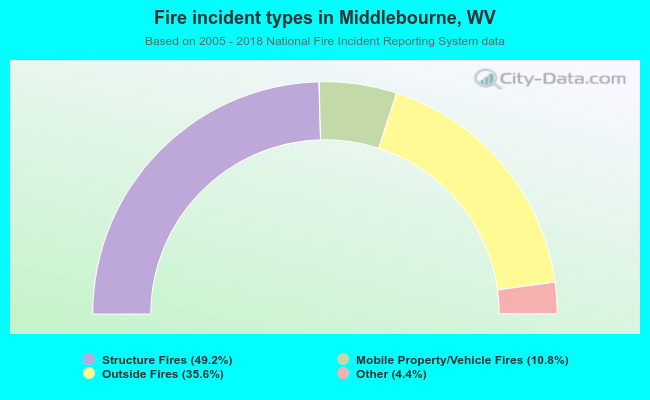 When looking into fire subcategories, the most incidents belonged to: Structure Fires (49.2%), and Outside Fires (35.6%).