Merrill: Fire Incidents, Michigan (MI)
Where are fire incidents reported in Merrill, MI
Something went wrong! Please refresh the page.
|
| |||||||||||||||||||||||||||||||||||||||||||||||||||||||||||||||||||||||||||||||||||||||||||||||||||||||||||||
2002 - 2018 National Fire Incident Reporting System (NFIRS) incidents
- Incident types reported to NFIRS in Merrill, MI
- 92255.8%Rescue & EMS
- 38823.5%Fire
- 19912.1%Hazardous Condition
- 1066.4%Good Intent Call
- 201.2%Service Call
- 120.7%False Alarm
- 20.1%Severe Weather
- Fire incident types reported to NFIRS in Merrill, MI
- 22758.5%Structure Fires
- 10326.5%Outside Fires
- 4812.4%Mobile Property/Vehicle Fires
- 102.6%Other
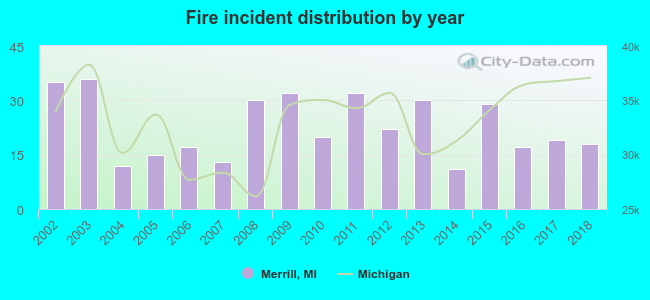 Based on the data from the years 2002 - 2018 the average number of fires per year is 23. The highest number of reported fire incidents - 36 took place in 2003, and the least - 11 in 2014. The data has a decreasing trend.
 34.3% incidents where reported in the morning and 65.7% in the evening. The most fires (18.3%) took place on Tuesday, and the least (10.8%) on Wednesday.
 Based on the 388 reports from years 2002 - 2018 most fires (13.1%) took place during April, and the least (3.9%) in December.
 Out of all 1,651 cases reported during the years 2002 - 2018, the most belonged to the categories: Rescue & EMS (55.8%), Fire (23.5%), and Hazardous Condition (12.1%).
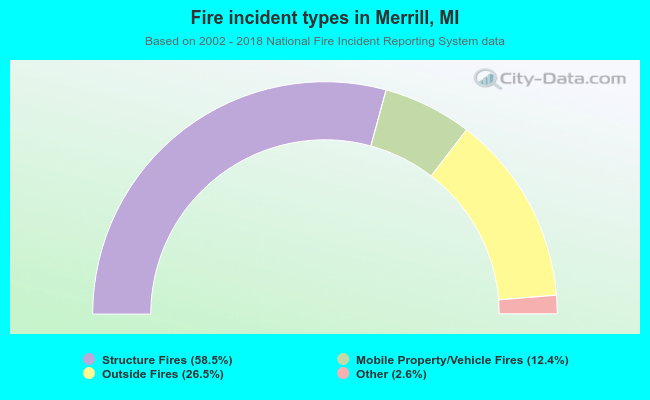 When looking into fire subcategories, the most incidents belonged to: Structure Fires (58.5%), and Outside Fires (26.5%).