Merino: Fire Incidents, Colorado (CO)
Where are fire incidents reported in Merino, CO
Something went wrong! Please refresh the page.
|
| |||||||||||||||||||||||||||||||||||||||||||||||||||||||||||||||||||||||||||||||||||||||||||||||||||||||||||||
| Other | 5 | |||||||||||||||||||||||||||||||||||||||||||||||||||||||||||||||||||||||||||||||||||||||||||||||||||||||||||||
2002 - 2018 National Fire Incident Reporting System (NFIRS) incidents
- Incident types reported to NFIRS in Merino, CO
- 26742.4%Rescue & EMS
- 22135.1%Fire
- 8613.7%Good Intent Call
- 294.6%Hazardous Condition
- 203.2%Service Call
- 50.8%Severe Weather
- 20.3%False Alarm
- Fire incident types reported to NFIRS in Merino, CO
- 16976.5%Outside Fires
- 2712.2%Structure Fires
- 2310.4%Mobile Property/Vehicle Fires
- 20.9%Other
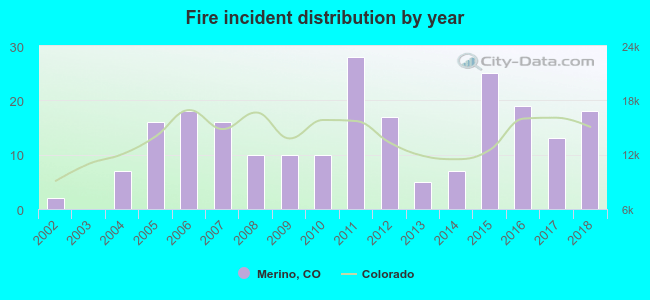 According to the data from the years 2002 - 2018 the average number of fire incidents per year is 13. The highest number of reported fire incidents - 28 took place in 2011, and the least - 0 in 2003. The data has a rising trend.
 27.6% incidents where reported in the morning and 72.4% in the evening. The most fires (17.2%) took place on Thursday, and the least (12.2%) on Tuesday.
 Based on the 221 fire incident reports from years 2002 - 2018 most fires (14.0%) took place during March, and the least (3.2%) in February.
 Out of all 630 cases reported during the years 2002 - 2018, the most belonged to the categories: Overpressure Rupture (42.4%), Fire (35.1%), and Service Call (13.7%).
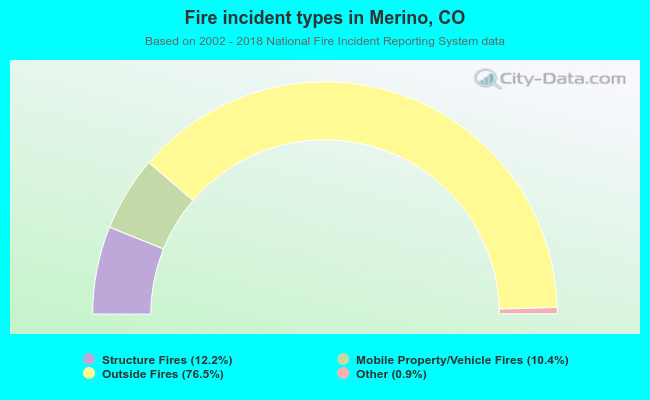 When looking into fire subcategories, the most reports belonged to: Outside Fires (76.5%), and Structure Fires (12.2%).