Mercer: Fire Incidents, Pennsylvania (PA)
Where are fire incidents reported in Mercer, PA
Something went wrong! Please refresh the page.
|
| |||||||||||||||||||||||||||||||||||||||||||||||||||||||||||||||||||||||||||||||||||||||||||||||||||||||||||||
2002 - 2018 National Fire Incident Reporting System (NFIRS) incidents
- Incident types reported to NFIRS in Mercer, PA
- 39235.2%Fire
- 21919.7%Rescue & EMS
- 15413.8%Hazardous Condition
- 13211.8%Service Call
- 11710.5%Good Intent Call
- 877.8%False Alarm
- 60.5%Overpressure Rupture
- 40.4%Severe Weather
- 30.3%Special Incident
- Fire incident types reported to NFIRS in Mercer, PA
- 23158.9%Structure Fires
- 8521.7%Outside Fires
- 6416.3%Mobile Property/Vehicle Fires
- 123.1%Other
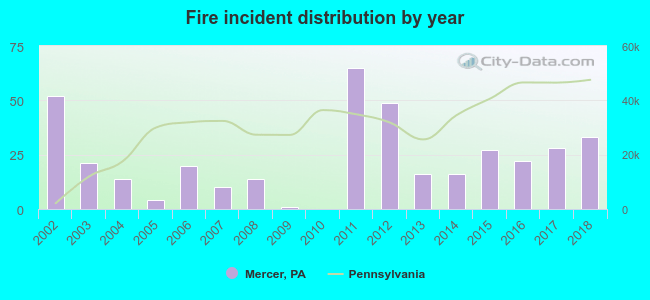 Based on the data from the years 2002 - 2018 the average number of fires per year is 23. The highest number of fire incidents - 65 took place in 2011, and the least - 0 in 2010. The data has a decreasing trend.
 37.5% incidents where reported in the morning and 62.5% in the evening. The most fires (17.3%) took place on Wednesday, and the least (11.5%) on Saturday.
 Based on the 392 fire incidents from years 2002 - 2018 most fires (13.0%) took place during March, and the least (5.1%) in February.
 Out of all 1,114 cases reported during the years 2002 - 2018, the most belonged to the categories: Fire (35.2%), Rescue & EMS (19.7%), and Hazardous Condition (13.8%).
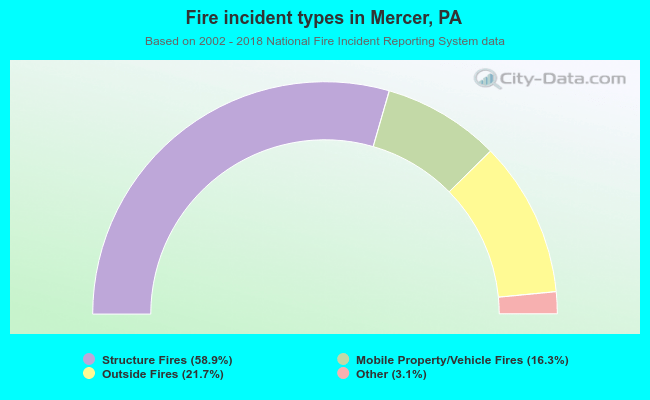 When looking into fire subcategories, the most incidents belonged to: Structure Fires (58.9%), and Outside Fires (21.7%).