Mentor: Fire Incidents, Ohio (OH)
Where are fire incidents reported in Mentor, OH
Something went wrong! Please refresh the page.
| Fire incidents reported | |
|---|---|
| Sreet name | Count |
| MENTOR AVE | 300 |
| MENTOR AV | 236 |
| REYNOLDS RD | 126 |
| HEISLEY RD | 108 |
| CENTER ST | 78 |
| TYLER BLVD | 70 |
| TYLER BL | 66 |
| HOPKINS RD | 60 |
| CENTER | 56 |
| MENTOR | 56 |
| LAKE SHORE BLVD | 46 |
| BROADMOOR RD | 44 |
| JOHNNYCAKE RIDGE RD | 34 |
| LAKESHORE | 34 |
| MUNSON RD | 30 |
| MENTOR AVE | 28 |
| HENDRICKS RD | 26 |
| TYLER | 26 |
| 2 | 24 |
| CORDUROY RD | 24 |
| CIVIC CENTER BLVD | 22 |
| EAST AVE | 22 |
| EMERALD CT | 22 |
| FOREST RD | 20 |
| HARBOR DR | 20 |
| LAKE SHORE BL | 20 |
| DIAMOND CENTRE DR | 18 |
| MIDLAND RD | 18 |
| ROBINWOOD DR | 18 |
| CORPORATE BLVD | 16 |
| Other | 202 |
2002 - 2018 National Fire Incident Reporting System (NFIRS) incidents
- Incident types reported to NFIRS in Mentor, OH
- 27,79366.9%Rescue & EMS
- 4,0879.8%Hazardous Condition
- 3,3388.0%Service Call
- 2,8846.9%False Alarm
- 1,8704.5%Fire
- 1,3463.2%Good Intent Call
- 1180.3%Special Incident
- 530.1%Overpressure Rupture
- Fire incident types reported to NFIRS in Mentor, OH
- 78141.8%Structure Fires
- 74940.1%Outside Fires
- 33017.6%Mobile Property/Vehicle Fires
- 100.5%Other
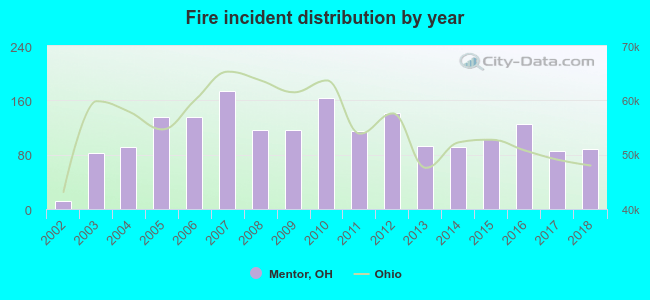 Based on the data from the years 2002 - 2018 the average number of fires per year is 110. The highest number of fire incidents - 174 took place in 2007, and the least - 12 in 2002. The data has a growing trend.
The average number of yearly fire incidents per 10k residents in Mentor, OH compared to nearest cities:
(Note: Based on data for the last 3 years, including only cities with population 5,000 and above)
| Mentor: | 21.3 |
| Willoughby: | 58.9 |
| Painesville: | 54.8 |
| Eastlake: | 50.2 |
| Kirtland: | 63.1 |
| Willowick: | 35.7 |
| Willoughby Hills: | 56.7 |
| Wickliffe: | 50.3 |
| Chardon: | 147.8 |
 The median response time based on all reported fire incidents is 6 minutes. This is similar to the state median value.
The median response time in Mentor, OH compared to nearest cities:
(Note: Based on data for all years, including only cities with at least 500 fire incidents)
| Mentor: | 6 minutes |
| Willoughby: | 4 minutes |
| Painesville: | 5 minutes |
| Eastlake: | 5 minutes |
| Kirtland: | 6 minutes |
| Willowick: | 4 minutes |
| Willoughby Hills: | 7 minutes |
| Wickliffe: | 5 minutes |
| Chardon: | 7 minutes |
 According to the data from the years 2002 - 2018 the average number of fire-related yearly casualties is 2. The highest number of injuries - 8 took place in 2006, and the lowest - 0 in 2002. The data has an increasing trend.
The average number of injuries per 1,000 fires is 19. This indicator was the highest - 59 in 2006, and the lowest 0 in 2002. The trend for casualties per 1,000 fire incidents is increasing. Compared to the state value the number of casualties per 1,000 fire incidents is higher.
According to the data from the years 2002 - 2018 the average number of fire-related yearly casualties is 2. The highest number of injuries - 8 took place in 2006, and the lowest - 0 in 2002. The data has an increasing trend.
The average number of injuries per 1,000 fires is 19. This indicator was the highest - 59 in 2006, and the lowest 0 in 2002. The trend for casualties per 1,000 fire incidents is increasing. Compared to the state value the number of casualties per 1,000 fire incidents is higher.Casualties per 1,000 incidents in Mentor, OH compared to nearest cities:
(Note: Based on data for all years, including only cities with at least 500 fire incidents)
| Mentor: | 20.3 |
| Willoughby: | 41.4 |
| Painesville: | 36.8 |
| Eastlake: | 55.6 |
| Kirtland: | 3.4 |
| Willowick: | 12.7 |
| Willoughby Hills: | 14.3 |
| Wickliffe: | 22.5 |
| Chardon: | 8.2 |
 29.4% incidents where reported in the morning and 70.6% in the evening. The most fires (15.5%) took place on Friday, and the least (12.9%) on Saturday.
 Based on the 1,870 reports from years 2002 - 2018 most fires (11.9%) took place during April, and the least (4.7%) in February.
 Out of all 41,520 cases reported during the years 2002 - 2018, the most belonged to the categories: Rescue & EMS (66.9%), Hazardous Condition (9.8%), and Service Call (8.0%).
 When looking into fire subcategories, the most incidents belonged to: Structure Fires (41.8%), and Outside Fires (40.1%).