| Fire incidents reported |
|---|
| Sreet name | Count |
|---|
| WALT WHITMAN ROAD | 54 | | BROAD HOLLOW ROAD | 42 | | LONG ISLAND EWAY | 32 | | LONG ISLAND E-WAY | 28 | | SWEET HOLLOW ROAD | 24 | | NORTH SERVICE ROAD | 14 | | PINELAWN ROAD | 14 | | ROUND SWAMP ROAD | 14 | | NEW YORK AVENUE | 12 | | SOUTH SERVICE ROAD | 12 | | ALTESSA BOULEVARDE | 10 | | BAGATELLE ROAD | 10 | | GWYNNE ROAD | 10 | | NORTHERN STATE PARKW | 10 | | OLD COUNTRY ROAD | 10 | | RULAND ROAD | 10 | | COURT NORTH DRIVE | 8 | | AVALON COURT DRIVE | 6 | | BAYLIS ROAD | 6 | | DURYEA ROAD | 6 | | MELVILLE ESTATES | 6 | | RIVENDELL COURT | 6 | | SPAGNOLI ROAD | 6 | | ADRIATIC DR DR | 4 | | ADRIATIC DRIVE | 4 |
| | | Fire incidents reported |
|---|
| Sreet name | Count |
|---|
| BEAUMONT DRIVE | 4 | | BRATTLE CIRCLE | 4 | | CABRIOLET LANE | 4 | | MARCUS DRIVE | 4 | | MAXESS RD | 4 | | MOUNT MISERY ROAD | 4 | | NEWTOWN LANE | 4 | | OLD COUNTRY RD | 4 | | OLD EAST NECK ROAD | 4 | | OLD SOUTH PATH | 4 | | SWEET HOLLOW RD | 4 | | WILMINGTON DRIVE | 4 | | 531 SWEET HOLLOW ROAD | 2 | | ADRIATIC BLVD | 2 | | ALDERFIELD LANE | 2 | | ALTESS BLVD | 2 | | ATTRIDGE COURT | 2 | | AVALON CT DRIVE | 2 | | BARTON AVENUE | 2 | | BIO SCIENCE PARK DRIVE | 2 | | BRADFORD PLACE | 2 | | BRATTLE CIRCLE CIR | 2 | | BROADHOLLOW ROAD | 2 | | CANON PLAZAWALT WHITMAN ROAD | 2 | | CATHERWOOD CRESCENT | 2 |
|
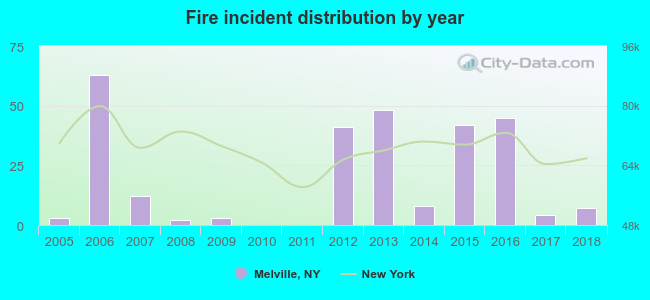 Based on the data from the years 2005 - 2018 the average number of fire incidents per year is 20. The highest number of fires - 63 took place in 2006, and the least - 0 in 2010. The data has an increasing trend.
 29.5% incidents where reported in the morning and 70.5% in the evening. The most fires (16.5%) took place on Monday, and the least (10.8%) on Wednesday.
 According to the 278 reports from years 2005 - 2018 most fires (14.0%) took place during April, and the least (2.5%) in February.
 Out of all 3,924 cases reported during the years 2005 - 2018, the most belonged to the categories: Rescue & EMS (52.3%), Good Intent Call (14.6%), and Hazardous Condition (12.1%).
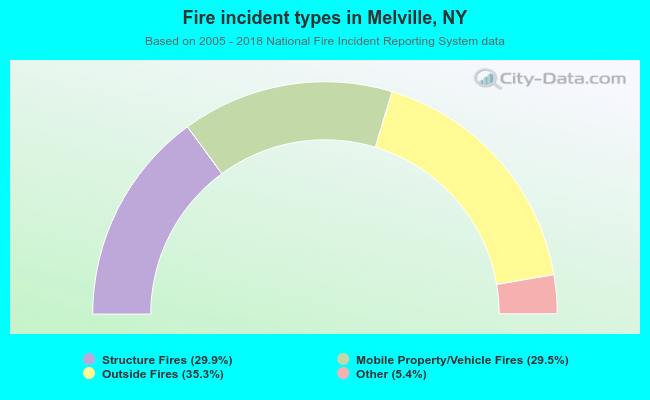 When looking into fire subcategories, the most incidents belonged to: Outside Fires (35.3%), and Structure Fires (29.9%).