| Fire incidents reported |
|---|
| Sreet name | Count |
|---|
| HWY 6084 | 24 | | 60/84 | 10 | | 6084 | 10 | | HWY 268 | 8 | | 6084 HWY | 6 | | HWY 267 | 6 | | NM 267 | 6 | | S.R. 268 | 6 | | 2ND AND HIGBY | 4 | | 60 & 84 HWY | 4 | | C.R. 18 | 4 | | HWY 60/84 | 4 | | HWY 6084 HWY | 4 | | RR AV | 4 | | 100 WEST ABO HWY | 2 | | 101 W AVE A | 2 | | 12 MILES WEST OF MELROSE ON 60 | 2 | | 1534 S.R. 224 | 2 | | 2 MILES NORTH ON 268 | 2 | | 200 8TH | 2 | | 2151 SR 268 HWY | 2 | | 2200 CR 15 | 2 | | 2300 CURRY RD W | 2 | | 267 HWY | 2 | | 268 | 2 |
| | | Fire incidents reported |
|---|
| Sreet name | Count |
|---|
| 2851 QUAY RD 34 | 2 | | 2ND & AVE C | 2 | | 3198 CR 19 | 2 | | 3395 CR AG | 2 | | 3425 CURRY ROAD 13 RD | 2 | | 3451 CR 11 | 2 | | 3556 CURRY RD 5 | 2 | | 3575 CR 15 | 2 | | 3800 CR 5 | 2 | | 3848 SR 89 | 2 | | 3RD AND HIGBY | 2 | | 400 N MAIN | 2 | | 4020 CR 18 | 2 | | 405 5TH STREET | 2 | | 406 CARTER ST | 2 | | 413 MOSS | 2 | | 500 E AVE C | 2 | | 503 9TH ST | 2 | | 5TH AN DENBY [60\84] | 2 | | 60 / 84 HWY | 2 | | 60 84 AND CR AL | 2 | | 60-84 MILE MARKER 370 | 2 | | 60/84 HWY | 2 | | 6084 CR X | 2 | | |
|
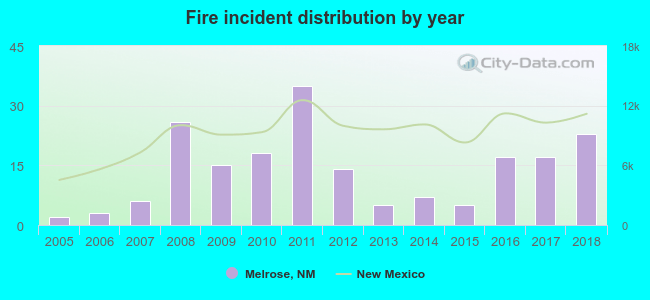 According to the data from the years 2005 - 2018 the average number of fires per year is 14. The highest number of fires - 35 took place in 2011, and the least - 2 in 2005. The data has an increasing trend.
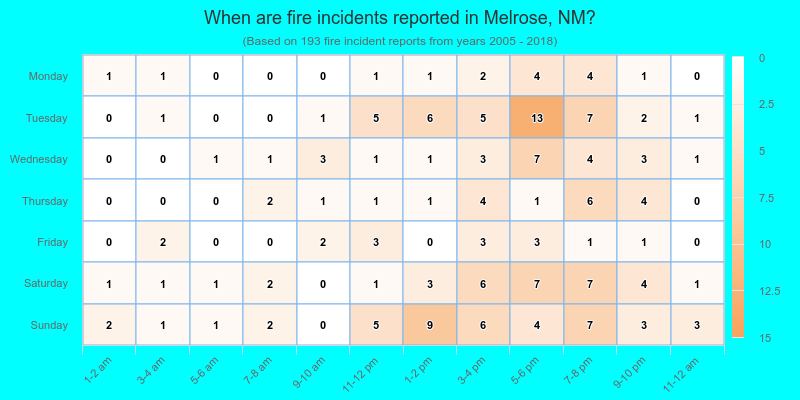
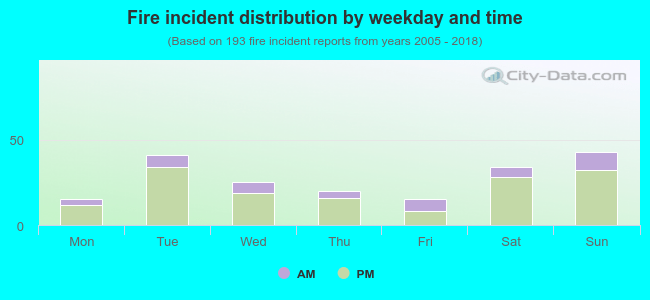 22.8% incidents where reported in the morning and 77.2% in the evening. The most fires (22.3%) took place on Sunday, and the least (7.8%) on Monday.
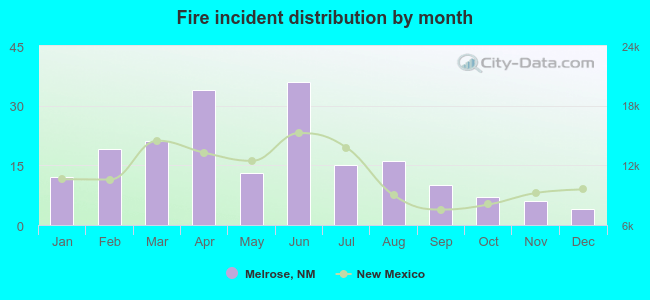 According to the 193 reports from years 2005 - 2018 most fires (18.7%) took place during June, and the least (2.1%) in December.
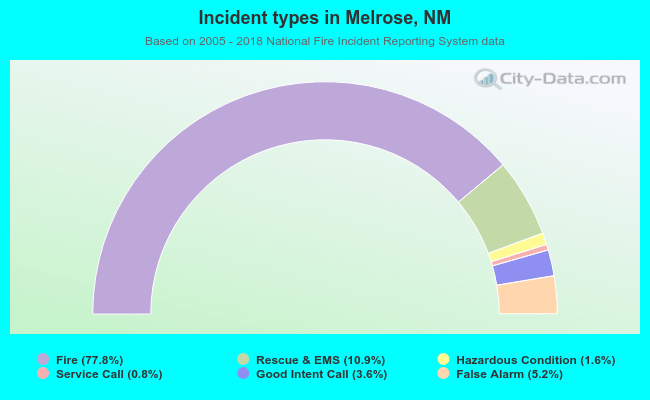 Out of all 248 cases reported during the years 2005 - 2018, the most belonged to the categories: Fire (77.8%), Overpressure Rupture (10.9%), and Good Intent Call (5.2%).
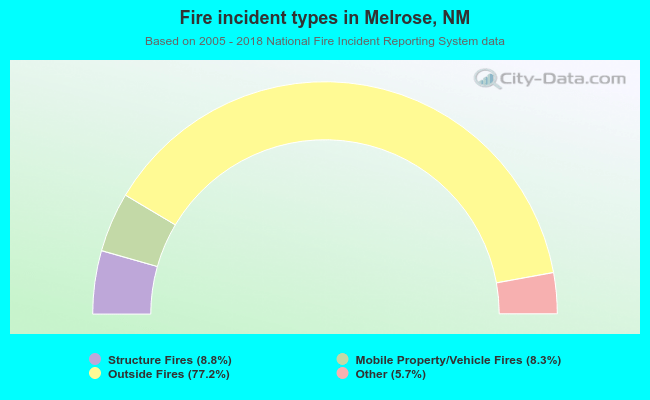 When looking into fire subcategories, the most reports belonged to: Outside Fires (77.2%), and Structure Fires (8.8%).