Melbourne Beach: Fire Incidents, Florida (FL)
Where are fire incidents reported in Melbourne Beach, FL
Something went wrong! Please refresh the page.
|
| |||||||||||||||||||||||||||||||||||||||||||||||||||||||||||||||||||||||||||||||||||||||||||||||||||||||||||||
2003 - 2018 National Fire Incident Reporting System (NFIRS) incidents
- Incident types reported to NFIRS in Melbourne Beach, FL
- 2,76667.6%Rescue & EMS
- 3478.5%Hazardous Condition
- 3418.3%Service Call
- 2435.9%False Alarm
- 2095.1%Fire
- 1684.1%Good Intent Call
- 90.2%Special Incident
- 60.1%Severe Weather
- Fire incident types reported to NFIRS in Melbourne Beach, FL
- 10349.3%Outside Fires
- 6832.5%Structure Fires
- 2913.9%Mobile Property/Vehicle Fires
- 94.3%Other
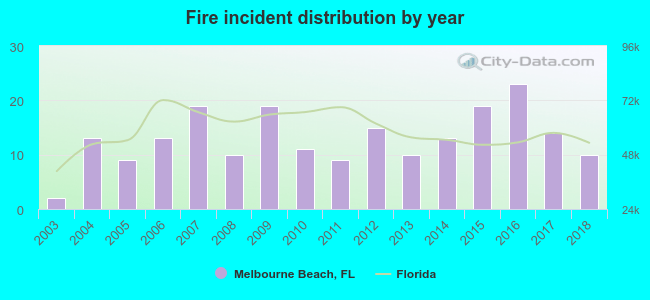 Based on the data from the years 2003 - 2018 the average number of fire incidents per year is 13. The highest number of reported fire incidents - 23 took place in 2016, and the least - 2 in 2003. The data has a rising trend.
 32.1% incidents where reported in the morning and 67.9% in the evening. The most fires (19.6%) took place on Sunday, and the least (7.2%) on Monday.
 Based on the 209 fires from years 2003 - 2018 most fires (12.0%) took place during July, and the least (4.3%) in August.
 Out of all 4,092 cases reported during the years 2003 - 2018, the most belonged to the categories: Rescue & EMS (67.6%), Hazardous Condition (8.5%), and Service Call (8.3%).
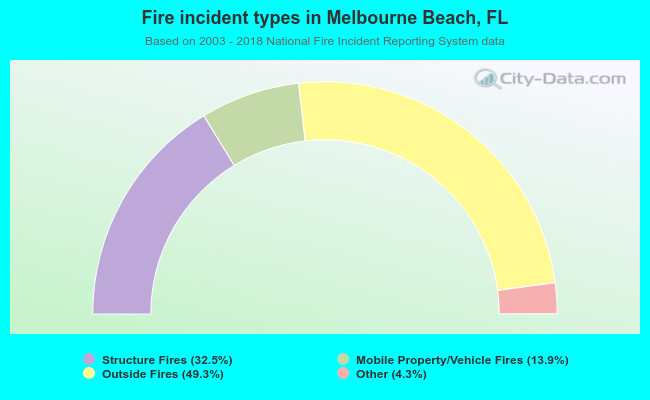 When looking into fire subcategories, the most incidents belonged to: Outside Fires (49.3%), and Structure Fires (32.5%).