| Fire incidents reported |
|---|
| Sreet name | Count |
|---|
| ALLMAN ST | 6 | | APPLE AVENUE AVE | 6 | | 8TH ST | 4 | | CASTLE ROAD RD | 4 | | COUNTY Q | 4 | | CTHM | 4 | | HILLTOP ROAD | 4 | | M HWY | 4 | | MAIN ST | 4 | | MARTIN DR | 4 | | ORIOLE DR | 4 | | ORIOLE DR | 4 | | PARK AVE | 4 | | PERKINS | 4 | | PINE AVENUE AVE | 4 | | SETTLEMENT DR | 4 | | W 4959 APPLE AVE | 4 | | W4466 KUMMER LANE | 2 | | #59 MCT | 2 | | 1/4 MILE N OF CASTLE ON CENTER | 2 | | 130 PARK AVE | 2 | | 204 N WASHINGTON AVE | 2 | | 215 WASHINGTON AVE | 2 | | 221 S PARK AVE | 2 | | 233 S MAIN ST | 2 |
| | | Fire incidents reported |
|---|
| Sreet name | Count |
|---|
| 2ND ST | 2 | | 346 SMAIN ST | 2 | | 5017 DR | 2 | | 6173 GAD DR | 2 | | 624 SOUTH PARK AVE | 2 | | 64 HWY | 2 | | 820 RIVER DR | 2 | | ALLMAN AVE | 2 | | ALLMAN AVE | 2 | | APPLE AVE | 2 | | BAUER DRIV | 2 | | BRINK AVENUE AVE | 2 | | BRINK RD | 2 | | CASTLE RD | 2 | | CASTLE RD | 2 | | CENTER AVE | 2 | | CENTRAL AVE | 2 | | COUNTRY ROAD E | 2 | | COUNTY ROAD E | 2 | | COUNTY ROAD M | 2 | | COVERED BRIDGE BY MAPLE ISLAND | 2 | | CRANE DR | 2 | | CRANE DR | 2 | | CTY HWY O | 2 | | CTY RD D | 2 |
|
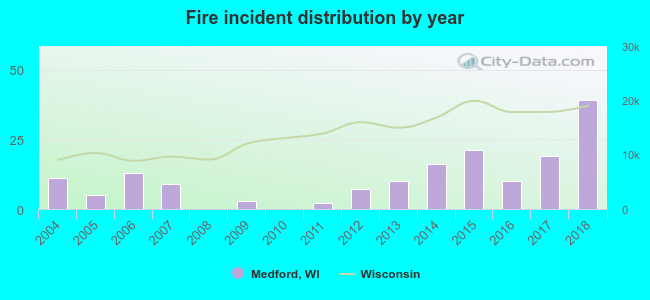 Based on the data from the years 2004 - 2018 the average number of fires per year is 11. The highest number of fire incidents - 39 took place in 2018, and the least - 0 in 2008. The data has a rising trend.
 31.5% incidents where reported in the morning and 68.5% in the evening. The most fires (22.4%) took place on Saturday, and the least (9.1%) on Wednesday.
 According to the 165 fire incident reports from years 2004 - 2018 most fires (16.4%) took place during May, and the least (1.8%) in August.
 Out of all 311 cases reported during the years 2004 - 2018, the most belonged to the categories: Fire (53.1%), Overpressure Rupture (25.1%), and Rescue & EMS (11.9%).
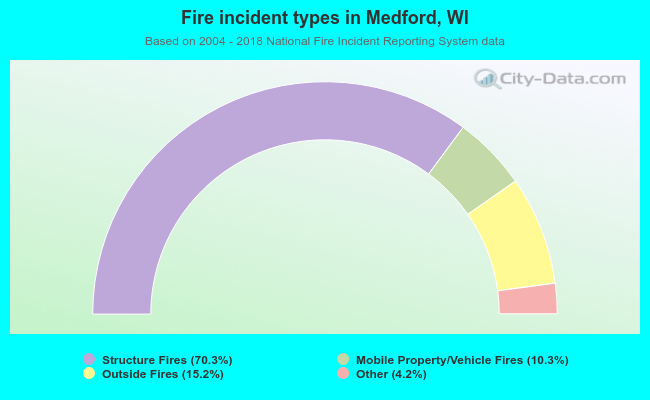 When looking into fire subcategories, the most reports belonged to: Structure Fires (70.3%), and Outside Fires (15.2%).