| Fire incidents reported |
|---|
| Sreet name | Count |
|---|
| ILLINOIS HIGHWAY 89 HWY | 12 | | MCNABB BLACKTOP | 10 | | MAIN ST | 8 | | 350TH AVE | 6 | | HATTONS RD | 6 | | MCNABB BLACKTOP HWY | 6 | | MERIDIAN RD | 6 | | FRANKLIN ST | 4 | | ILLINOIS HIGHWAY 26 HWY | 4 | | MCNABB BLACKTOP RD | 4 | | PARK DR | 4 | | RAILROAD ST | 4 | | WOODY WALKER HILL RD | 4 | | .2 MILE SOUTH OF E 1ST | 2 | | 1075TH ST | 2 | | 1075TH STRE | 2 | | 11207 WOODY WALKER HILL | 2 | | 1125 | 2 | | 1150 RD | 2 | | 1150TH EAST MCNABB BLACKTOP | 2 | | 1150TH RD | 2 | | 11818 N. 250TH AVE | 2 | | 1200 | 2 | | 1200 E | 2 | | 1200 ST ST | 2 |
| | | Fire incidents reported |
|---|
| Sreet name | Count |
|---|
| 1200TH ST | 2 | | 12522 MCNABB BLACKTOP | 2 | | 15802 FRANKLIN ST. | 2 | | 1600TH ST | 2 | | 200 NORTH ROAD | 2 | | 250 AVE | 2 | | 300 N | 2 | | 350TH AVE AVE | 2 | | 350TH RD | 2 | | 3647 SWANEY RD. | 2 | | 3752 FISHNFUN RD | 2 | | 391 IL RT 89 HWY | 2 | | 400TH AVE | 2 | | 404 W MAIN ST | 2 | | 4120 IL HWY 89 | 2 | | 50 E. PARK DRIVE | 2 | | 500 W. MAIN ST. | 2 | | 5131 E 1200 | 2 | | 5220 HATTON ROAD | 2 | | 5293 HATTANS RD | 2 | | 5293 HATTON RD | 2 | | 576 N 1200TH AVE | 2 | | 600TH AVE | 2 | | 600TH AVE AVE | 2 | | |
|
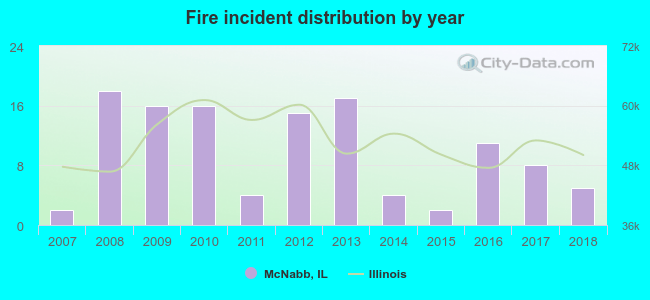 According to the data from the years 2007 - 2018 the average number of fire incidents per year is 10. The highest number of fires - 18 took place in 2008, and the least - 2 in 2007. The data has a growing trend.
 20.3% incidents where reported in the morning and 79.7% in the evening. The most fires (20.3%) took place on Sunday, and the least (7.6%) on Wednesday.
 According to the 118 incident reports from years 2007 - 2018 most fires (22.0%) took place during April, and the least (1.7%) in May.
 Out of all 189 cases reported during the years 2007 - 2018, the most belonged to the categories: Fire (62.4%), Hazardous Condition (13.8%), and Rescue & EMS (11.6%).
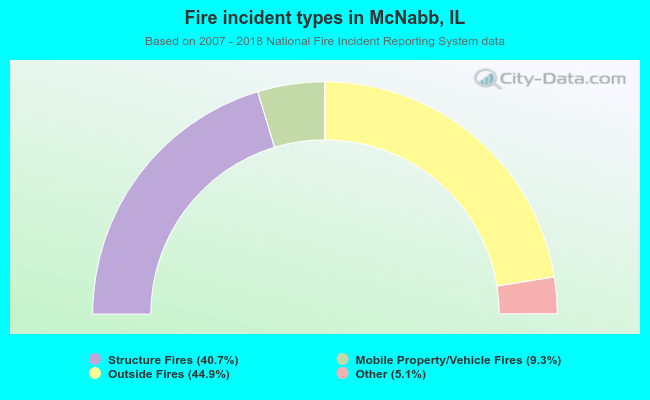 When looking into fire subcategories, the most incidents belonged to: Outside Fires (44.9%), and Structure Fires (40.7%).