McLeansboro: Fire Incidents, Illinois (IL)
Where are fire incidents reported in McLeansboro, IL
Something went wrong! Please refresh the page.
|
| |||||||||||||||||||||||||||||||||||||||||||||||||||||||||||||||||||||||||||||||||||||||||||||||||||||||||||||
| Other | 177 | |||||||||||||||||||||||||||||||||||||||||||||||||||||||||||||||||||||||||||||||||||||||||||||||||||||||||||||
2006 - 2018 National Fire Incident Reporting System (NFIRS) incidents
- Incident types reported to NFIRS in McLeansboro, IL
- 38178.2%Fire
- 377.6%Rescue & EMS
- 275.5%Hazardous Condition
- 173.5%Good Intent Call
- 163.3%False Alarm
- 51.0%Service Call
- 30.6%Severe Weather
- 10.2%Overpressure Rupture
- Fire incident types reported to NFIRS in McLeansboro, IL
- 16944.4%Structure Fires
- 14137.0%Outside Fires
- 6416.8%Mobile Property/Vehicle Fires
- 71.8%Other
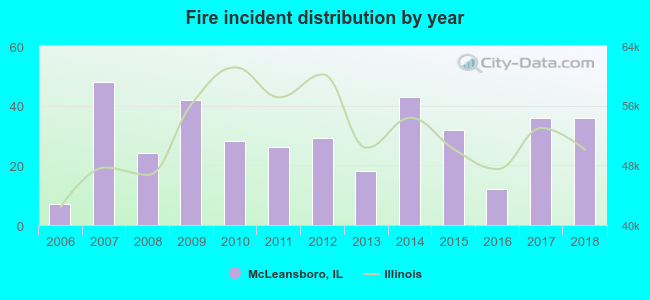 According to the data from the years 2006 - 2018 the average number of fire incidents per year is 29. The highest number of fires - 48 took place in 2007, and the least - 7 in 2006. The data has a growing trend.
 According to the reports from the years 2006 - 2018 the average number of fire-related casualties per year is 0. The highest number of casualties - 3 took place in 2007, and the lowest - 0 in 2006. The data has a constant trend.
 33.6% incidents where reported in the morning and 66.4% in the evening. The most fires (17.6%) took place on Sunday, and the least (10.0%) on Wednesday.
 Based on the 381 incident reports from years 2006 - 2018 most fires (15.0%) took place during March, and the least (5.2%) in July.
 Out of all 487 cases reported during the years 2006 - 2018, the most belonged to the categories: Fire (78.2%), Rescue & EMS (7.6%), and Hazardous Condition (5.5%).
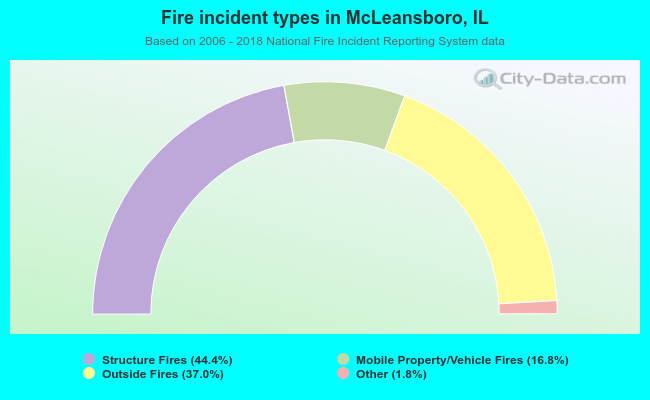 When looking into fire subcategories, the most reports belonged to: Structure Fires (44.4%), and Outside Fires (37.0%).