| Fire incidents reported |
|---|
| Sreet name | Count |
|---|
| LINCOLN WAY | 28 | | GREAT COVE RD | 22 | | LINCOLN HIGHWAY | 16 | | BREEZY POINT RD | 10 | | BUCHANAN TRL | 10 | | CITO RD | 10 | | KNOBSVILLE RD | 10 | | SECOND ST | 10 | | BACK RUN RD | 8 | | BLACKBERRY LA | 8 | | LINCOLN WAY | 8 | | WOODSIDE DR | 8 | | DUTCH CORNER RD | 6 | | LIONS PARK DR | 6 | | FIRST | 4 | | GERALD CIR | 4 | | HILLSIDE ESTS | 4 | | LINCOLN WAY EAST | 4 | | LITTLE COVE RD | 4 | | MARKET ST | 4 | | PROMISE LAND RD | 4 | | RAVENSBURG RD | 4 | | SHADY GROVE DR | 4 | | 13036 GREAT COVE RD | 2 | | 13462 SIPES MILL RD | 2 |
| | | Fire incidents reported |
|---|
| Sreet name | Count |
|---|
| 153 MCGOVERNS LANE | 2 | | 17000 BLOCK LINCOLN HIGHWAY E | 2 | | 213 PINE TREE FARM LANE | 2 | | 219 N 2ND ST ST | 2 | | 3132 BUCHANAN TRAIL | 2 | | 45 BROOKYN LANE | 2 | | 525 FULTON DRIVE | 2 | | 526 LINCOLN WAY WEST | 2 | | 708 LINCOLN WAY EAST ST | 2 | | 708 LWE | 2 | | 856 LWE | 2 | | 875 R D LANE | 2 | | AUGWICK RD | 2 | | BACK RUN RD | 2 | | BIG COVE TANNERY RD | 2 | | BLACK BEAR RD | 2 | | BUCAHNAN TR | 2 | | BUCHANANTRAIL WEST | 2 | | BUCHANON TRL | 2 | | CENTER SQUARE | 2 | | CHERRY LANE | 2 | | CHERRY LN | 2 | | CHERRY ST | 2 | | CLAYLICK RD | 2 | | |
|
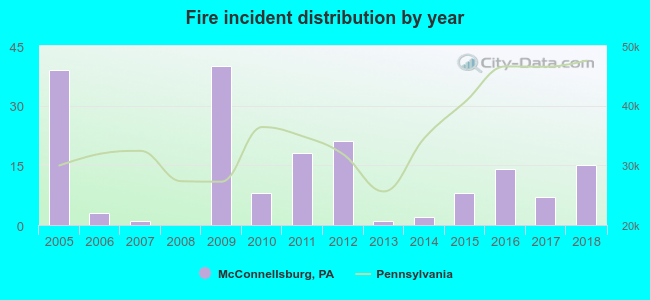 According to the data from the years 2005 - 2018 the average number of fires per year is 13. The highest number of reported fires - 40 took place in 2009, and the least - 0 in 2008. The data has a declining trend.
 36.2% incidents where reported in the morning and 63.8% in the evening. The most fires (18.1%) took place on Saturday, and the least (12.4%) on Tuesday.
 Based on the 177 fire incidents from years 2005 - 2018 most fires (11.9%) took place during April, and the least (5.1%) in May.
 Out of all 593 cases reported during the years 2005 - 2018, the most belonged to the categories: Fire (29.8%), Overpressure Rupture (29.7%), and Hazardous Condition (13.3%).
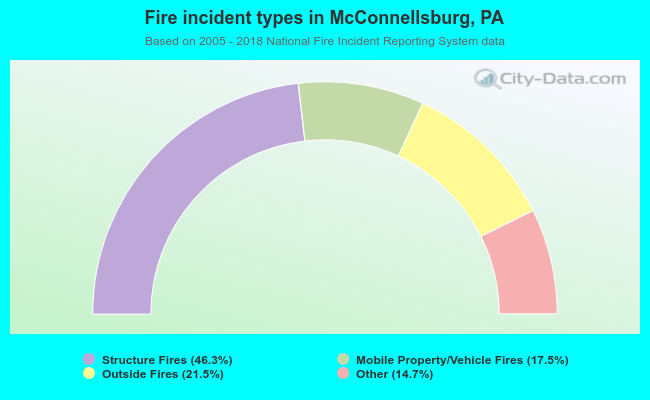 When looking into fire subcategories, the most reports belonged to: Structure Fires (46.3%), and Outside Fires (21.5%).