McClure: Fire Incidents, Ohio (OH)
Where are fire incidents reported in McClure, OH
Something went wrong! Please refresh the page.
|
| |||||||||||||||||||||||||||||||||||||||||||||||||||||||||||||||||||||||||||||||||||||||||||||||||||||||||||||
2002 - 2018 National Fire Incident Reporting System (NFIRS) incidents
- Incident types reported to NFIRS in McClure, OH
- 21144.3%Fire
- 13728.8%Rescue & EMS
- 9018.9%Hazardous Condition
- 132.7%Good Intent Call
- 122.5%False Alarm
- 71.5%Service Call
- 40.8%Severe Weather
- 10.2%Overpressure Rupture
- 10.2%Special Incident
- Fire incident types reported to NFIRS in McClure, OH
- 9846.4%Structure Fires
- 6731.8%Outside Fires
- 4320.4%Mobile Property/Vehicle Fires
- 31.4%Other
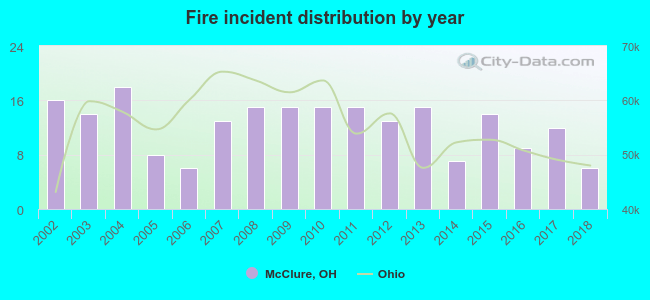 According to the data from the years 2002 - 2018 the average number of fire incidents per year is 12. The highest number of reported fire incidents - 18 took place in 2004, and the least - 6 in 2006. The data has a declining trend.
 Based on the data from the years 2002 - 2018 the average number of fire-related yearly casualties is 0. The highest number of injuries - 1 took place in 2004, and the lowest - 0 in 2002. The data has a constant trend.
 34.6% incidents where reported in the morning and 65.4% in the evening. The most fires (16.1%) took place on Wednesday, and the least (10.9%) on Tuesday.
 Based on the 211 incident reports from years 2002 - 2018 most fires (17.1%) took place during October, and the least (4.3%) in December.
 Out of all 476 cases reported during the years 2002 - 2018, the most belonged to the categories: Fire (44.3%), Rescue & EMS (28.8%), and Hazardous Condition (18.9%).
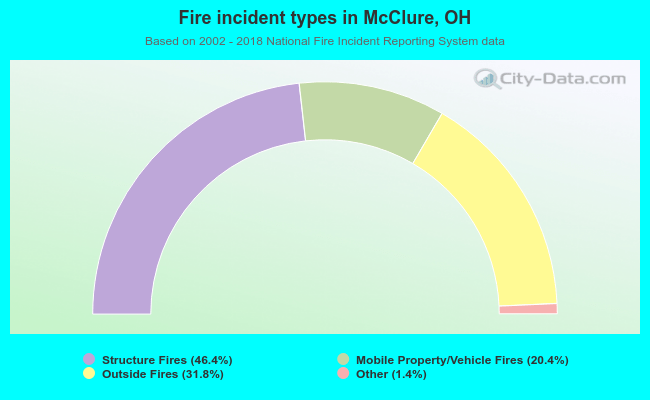 When looking into fire subcategories, the most incidents belonged to: Structure Fires (46.4%), and Outside Fires (31.8%).