Mayville: Fire Incidents, Michigan (MI)
Where are fire incidents reported in Mayville, MI
Something went wrong! Please refresh the page.
|
| |||||||||||||||||||||||||||||||||||||||||||||||||||||||||||||||||||||||||||||||||||||||||||||||||||||||||||||
2002 - 2018 National Fire Incident Reporting System (NFIRS) incidents
- Incident types reported to NFIRS in Mayville, MI
- 38553.3%Fire
- 15922.0%Hazardous Condition
- 10514.5%Rescue & EMS
- 344.7%Good Intent Call
- 192.6%False Alarm
- 131.8%Service Call
- 30.4%Overpressure Rupture
- 30.4%Severe Weather
- 10.1%Special Incident
- Fire incident types reported to NFIRS in Mayville, MI
- 23761.6%Structure Fires
- 9123.6%Outside Fires
- 4411.4%Mobile Property/Vehicle Fires
- 133.4%Other
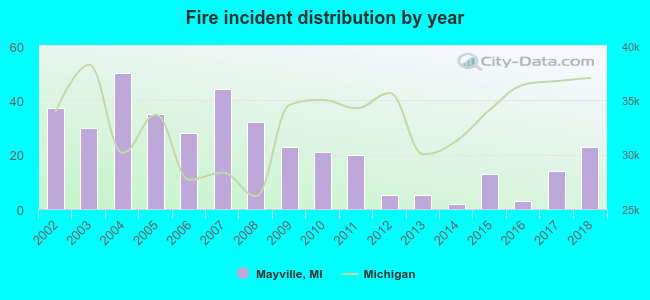 Based on the data from the years 2002 - 2018 the average number of fires per year is 23. The highest number of fires - 50 took place in 2004, and the least - 2 in 2014. The data has a dropping trend.
 31.9% incidents where reported in the morning and 68.1% in the evening. The most fires (18.2%) took place on Sunday, and the least (10.1%) on Thursday.
 According to the 385 fire incident reports from years 2002 - 2018 most fires (16.9%) took place during April, and the least (3.6%) in September.
 Out of all 722 cases reported during the years 2002 - 2018, the most belonged to the categories: Fire (53.3%), Hazardous Condition (22.0%), and Rescue & EMS (14.5%).
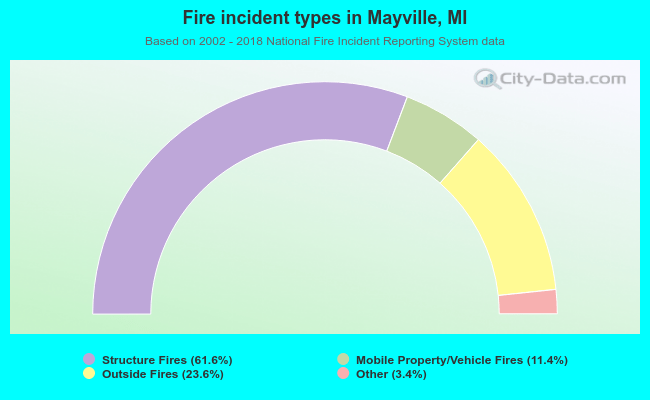 When looking into fire subcategories, the most reports belonged to: Structure Fires (61.6%), and Outside Fires (23.6%).