| Fire incidents reported |
|---|
| Sreet name | Count |
|---|
| RIVER RD | 78 | | HIGH ST | 56 | | DONEGAL SPRINGS RD | 50 | | COLEBROOK RD | 38 | | MAYTOWN RD | 22 | | HAUNSTEIN RD | 16 | | VINEGAR FERRY RD | 16 | | CENTER SQ | 14 | | QUEEN ST | 14 | | ALEXANDRIA CT | 12 | | ELIZABETH ST | 12 | | ENDSLOW RD | 12 | | ORE MINE RD | 12 | | RIVER ST | 12 | | CHELMSFORD DR | 10 | | DONEGAL CREEK RD | 10 | | HIGH ST | 10 | | MANSION LN | 10 | | STACKSTOWN RD | 10 | | WILD CHERRY LN | 10 | | KLINE RD | 8 | | LONG LN | 8 | | MAIN ST | 8 | | RIVER ROAD RD | 8 | | ANDERSON FERRY RD | 6 |
| | | Fire incidents reported |
|---|
| Sreet name | Count |
|---|
| BEATTYS TOLLGATE RD | 6 | | COFFEE GOSS RD | 6 | | COLEBROOK RD | 6 | | DONEGAL SPRINGS RD | 6 | | KRAYBILL CHURCH RD | 6 | | MAYTOWN RD | 6 | | OLD RIVER RD | 6 | | RED CEDAR LN | 6 | | RIVERMOOR DR | 6 | | VILLAGE SQUARE DR | 6 | | WASP ST | 6 | | WILD CHERRY LANE | 6 | | ASHLEY DR | 4 | | ASHLEY DRIVE DR | 4 | | CENTER SQUARE | 4 | | HIGH | 4 | | HIGH STREET ST | 4 | | HILLCREST RD | 4 | | KING ST | 4 | | MARIETTA AVE | 4 | | ORE MINE ROAD RD | 4 | | RED CEDAR LANE | 4 | | RIVER DR | 4 | | RIVER ST | 4 | | |
|
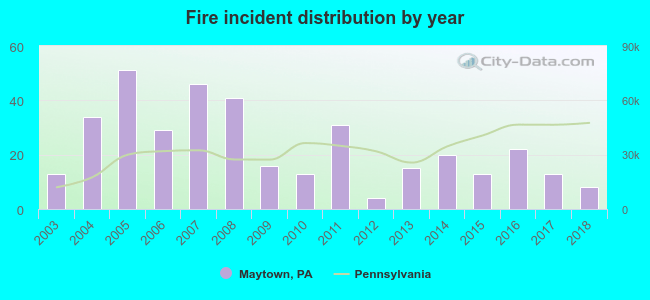 According to the data from the years 2003 - 2018 the average number of fires per year is 23. The highest number of reported fires - 51 took place in 2005, and the least - 4 in 2012. The data has a declining trend.
 30.5% incidents where reported in the morning and 69.5% in the evening. The most fires (19.2%) took place on Monday, and the least (9.7%) on Friday.
 Based on the 370 fire incidents from years 2003 - 2018 most fires (13.5%) took place during March, and the least (3.5%) in September.
 Out of all 780 cases reported during the years 2003 - 2018, the most belonged to the categories: Fire (47.4%), Good Intent Call (19.2%), and Rescue & EMS (12.1%).
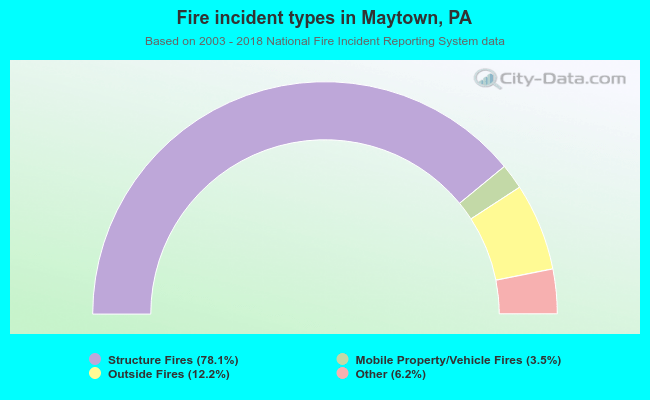 When looking into fire subcategories, the most reports belonged to: Structure Fires (78.1%), and Outside Fires (12.2%).