Mayer: Fire Incidents, Minnesota (MN)
Where are fire incidents reported in Mayer, MN
Something went wrong! Please refresh the page.
|
| |||||||||||||||||||||||||||||||||||||||||||||||||||||||||||||||||||||||||||||||||||||||||||||||||||||||||||||
2002 - 2018 National Fire Incident Reporting System (NFIRS) incidents
- Incident types reported to NFIRS in Mayer, MN
- 27345.6%Rescue & EMS
- 18430.7%Fire
- 538.8%Hazardous Condition
- 305.0%False Alarm
- 264.3%Good Intent Call
- 172.8%Severe Weather
- 152.5%Service Call
- 10.2%Special Incident
- Fire incident types reported to NFIRS in Mayer, MN
- 9652.2%Structure Fires
- 5932.1%Outside Fires
- 2312.5%Mobile Property/Vehicle Fires
- 63.3%Other
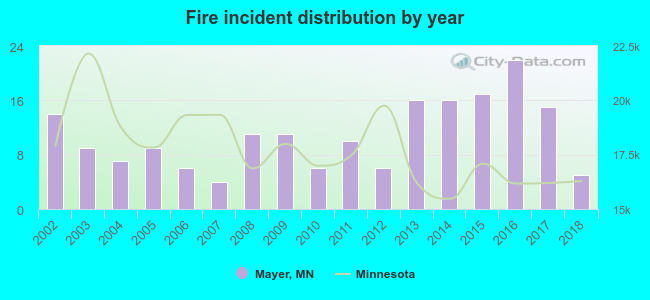 According to the data from the years 2002 - 2018 the average number of fire incidents per year is 11. The highest number of fire incidents - 22 took place in 2016, and the least - 4 in 2007. The data has a decreasing trend.
 38.0% incidents where reported in the morning and 62.0% in the evening. The most fires (18.5%) took place on Tuesday, and the least (10.3%) on Sunday.
 Based on the 184 fire incident reports from years 2002 - 2018 most fires (15.2%) took place during November, and the least (3.8%) in August.
 Out of all 599 cases reported during the years 2002 - 2018, the most belonged to the categories: Overpressure Rupture (45.6%), Fire (30.7%), and Rescue & EMS (8.8%).
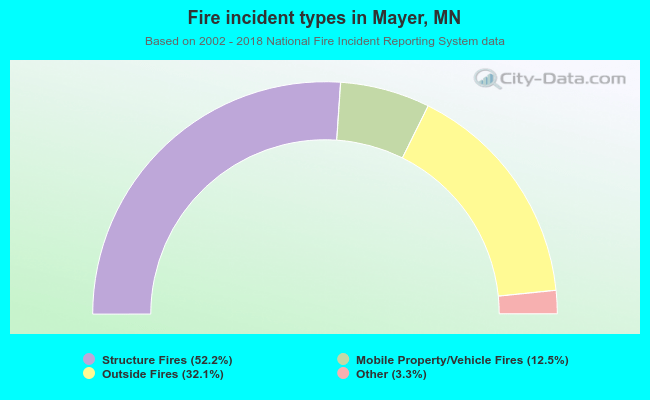 When looking into fire subcategories, the most incidents belonged to: Structure Fires (52.2%), and Outside Fires (32.1%).