Maurice: Fire Incidents, Louisiana (LA)
Where are fire incidents reported in Maurice, LA
Something went wrong! Please refresh the page.
|
| |||||||||||||||||||||||||||||||||||||||||||||||||||||||||||||||||||||||||||||||||||||||||||||||||||||||||||||
| Other | 15 | |||||||||||||||||||||||||||||||||||||||||||||||||||||||||||||||||||||||||||||||||||||||||||||||||||||||||||||
2002 - 2018 National Fire Incident Reporting System (NFIRS) incidents
- Incident types reported to NFIRS in Maurice, LA
- 66633.1%Good Intent Call
- 62030.8%Rescue & EMS
- 49324.5%Fire
- 1185.9%False Alarm
- 934.6%Hazardous Condition
- 201.0%Service Call
- Fire incident types reported to NFIRS in Maurice, LA
- 20842.2%Structure Fires
- 19840.2%Outside Fires
- 5110.3%Other
- 367.3%Mobile Property/Vehicle Fires
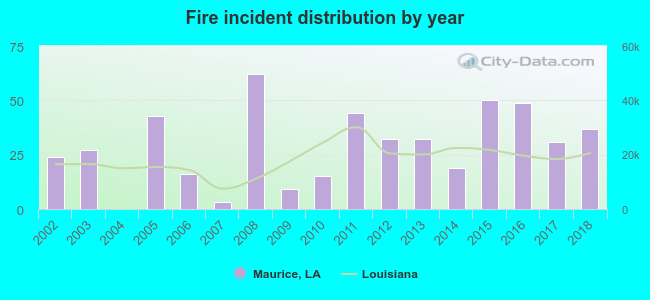 According to the data from the years 2002 - 2018 the average number of fires per year is 29. The highest number of fires - 62 took place in 2008, and the least - 0 in 2004. The data has a growing trend.
 27.2% incidents where reported in the morning and 72.8% in the evening. The most fires (18.1%) took place on Saturday, and the least (11.0%) on Thursday.
 According to the 493 fire incidents from years 2002 - 2018 most fires (10.8%) took place during November, and the least (5.9%) in March.
 Out of all 2,013 cases reported during the years 2002 - 2018, the most belonged to the categories: Good Intent Call (33.1%), Rescue & EMS (30.8%), and Fire (24.5%).
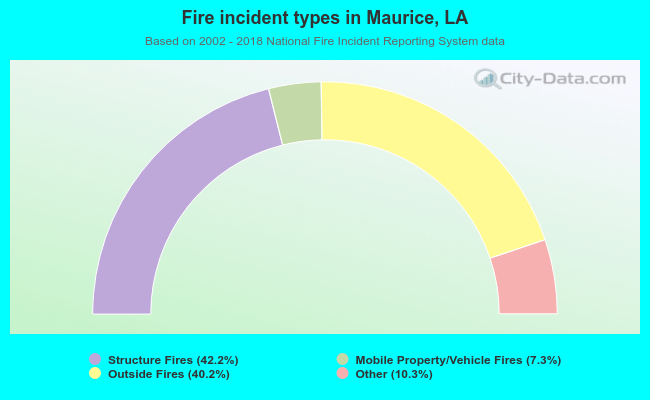 When looking into fire subcategories, the most reports belonged to: Structure Fires (42.2%), and Outside Fires (40.2%).