| Fire incidents reported |
|---|
| Sreet name | Count |
|---|
| HWY 216 HWY | 22 | | HWY 216 | 20 | | OLD WAPINITIA RD | 14 | | 216 HWY | 12 | | NATURAL PASTURE RD | 12 | | HWY 197 | 8 | | OAK SPRINGS RD | 8 | | VICTOR RD | 8 | | DESCHUTES AVE | 6 | | WAPINITIA RD | 6 | | 197TH HWY | 4 | | BAKEOVEN RD | 4 | | BLUE ROCK RD | 4 | | HWY 216 AND 197 | 4 | | JUNIPER FLATS | 4 | | KELLY CEMETARY | 4 | | KELLY SPRINGS RD | 4 | | OAK SPRING RD | 4 | | SMOCK RD | 4 | | WALTERS RD | 4 | | WATER AVE | 4 | | 15 NE OF 197AND216 JCT ALY | 2 | | 18 MI EAST ON EAST WAPINITIA RD | 2 | | 197 HWY | 2 | | 197 MP 51 HWY | 2 |
| | | Fire incidents reported |
|---|
| Sreet name | Count |
|---|
| 197 MP 52 AND BAKEOVEN RD HWY | 2 | | 197 MP 60 HWY | 2 | | 197 MP 60 TO 65 HWY | 2 | | 216 HIGHWAY RD | 2 | | 3 MI SW MAUPIN RIVER ACCESS RD | 2 | | 3 MIL SW OF MAUPIN RIVER ACCES RD | 2 | | 4TH ST | 2 | | 5 SO OF DODGE GRAVEL PIT | 2 | | 52984 ENDERSBY ROAD | 2 | | 57534 HAVEN AVE | 2 | | 5S13E/17/SE SE | 2 | | 6TH AND GRANT ST | 2 | | 81770 OLD WAPINITIA RD | 2 | | BAKE OVEN RD | 2 | | BARN | 2 | | BETWEEN VICTOR AND ART MORRIS RD | 2 | | BLM COMPOUND BAKEOVEN RD | 2 | | BLM OSP BAKEOVED RD COMPOUND | 2 | | BOTHWELL & NATURAL PASTURE RD | 2 | | BOTHWELL SO. OF 216 | 2 | | BY BARN | 2 | | BY GUN CLUB | 2 | | CARTER EAST | 2 | | D. HARRIS | 2 | | |
|
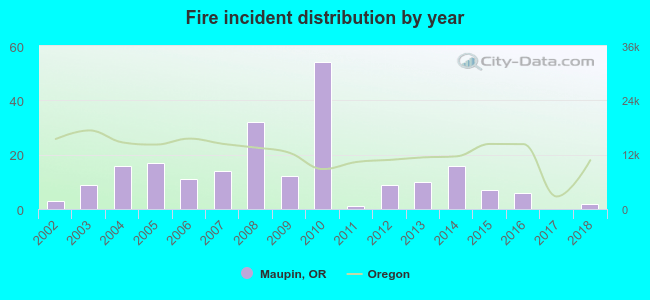 Based on the data from the years 2002 - 2018 the average number of fires per year is 13. The highest number of reported fire incidents - 54 took place in 2010, and the least - 0 in 2017. The data has a declining trend.
 22.4% incidents where reported in the morning and 77.6% in the evening. The most fires (29.2%) took place on Tuesday, and the least (7.8%) on Wednesday.
 According to the 219 fire incidents from years 2002 - 2018 most fires (40.2%) took place during August, and the least (0.9%) in January.
 Out of all 305 cases reported during the years 2002 - 2018, the most belonged to the categories: Fire (71.8%), Overpressure Rupture (14.8%), and Service Call (6.2%).
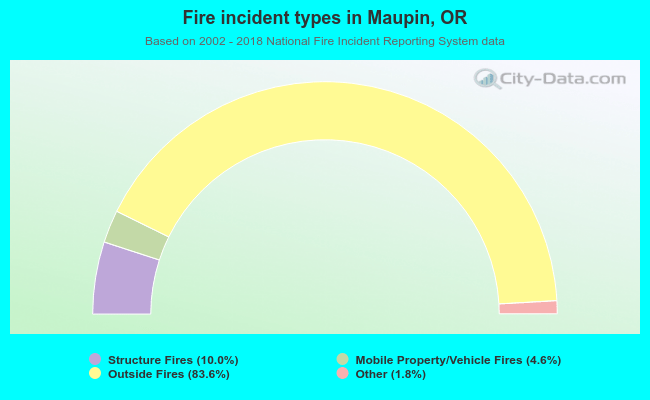 When looking into fire subcategories, the most incidents belonged to: Outside Fires (83.6%), and Structure Fires (10.0%).