| Fire incidents reported |
|---|
| Sreet name | Count |
|---|
| GREEN ST | 8 | | ST. RT. 10 | 8 | | 208 N WEST AVE | 6 | | MAIN ST | 6 | | 121 S GREEN ST | 4 | | 200 E PINE | 4 | | 3300 ECR | 4 | | 33058 SR 10 | 4 | | 3330 ECR 930N | 4 | | 35525 CR 900N | 4 | | 38278 CR 1300N | 4 | | 801 S. KEIFER | 4 | | CO RD 900 N | 4 | | CR 3600 | 4 | | HIGH ST | 4 | | MORGAN ST | 4 | | RT. 10 | 4 | | TONICA ST | 4 | | 1 COACHLIGHT VILLAGE | 2 | | 10131 N. CR. 3850 E. | 2 | | 104 N. MAIN ST | 2 | | 104 N. MAIN ST. | 2 | | 105 E JEFFERSON | 2 | | 1101 W. CHESTNUT ST | 2 | | 111 W. DOUGLAS ST. | 2 |
| | | Fire incidents reported |
|---|
| Sreet name | Count |
|---|
| 111.00 MAIN ST | 2 | | 115 E. JEFFERSON ST. | 2 | | 1150N CR | 2 | | 116 N. PERRY | 2 | | 11695 SR29 | 2 | | 11825 CR 3900 E. | 2 | | 12 MI WEST OF 3180 E RT10 | 2 | | 120 S. MAIN ST. | 2 | | 1200 | 2 | | 1200 N. | 2 | | 12016 CR2800E | 2 | | 1213 E PINE | 2 | | 122 N. TONICA | 2 | | 123 N LOGAN | 2 | | 123 N MORGAN | 2 | | 12372 CR 3700 E | 2 | | 126 N TONICA ST | 2 | | 129 E CHESTNUT ST | 2 | | 13156 CR 3600 E. | 2 | | 13648 CR 3400 E | 2 | | 13680 CR3700E | 2 | | 14570 CO RD 3600 E | 2 | | 15136 ST. RT. 29 | 2 | | 1524 E. CHESTNUT ST. | 2 | | |
|
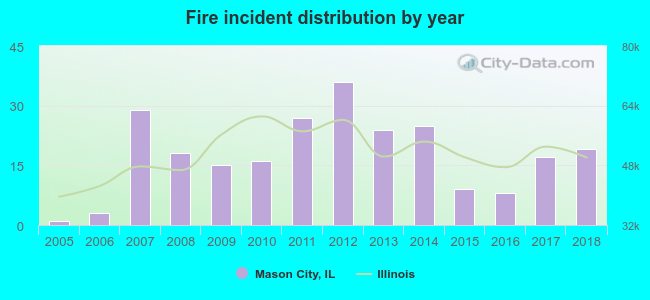 Based on the data from the years 2005 - 2018 the average number of fire incidents per year is 18. The highest number of reported fire incidents - 36 took place in 2012, and the least - 1 in 2005. The data has an increasing trend.
 20.6% incidents where reported in the morning and 79.4% in the evening. The most fires (19.4%) took place on Sunday, and the least (7.7%) on Tuesday.
 According to the 247 incident reports from years 2005 - 2018 most fires (12.6%) took place during April, and the least (5.3%) in January.
 Out of all 465 cases reported during the years 2005 - 2018, the most belonged to the categories: Fire (53.1%), Overpressure Rupture (23.2%), and Rescue & EMS (13.1%).
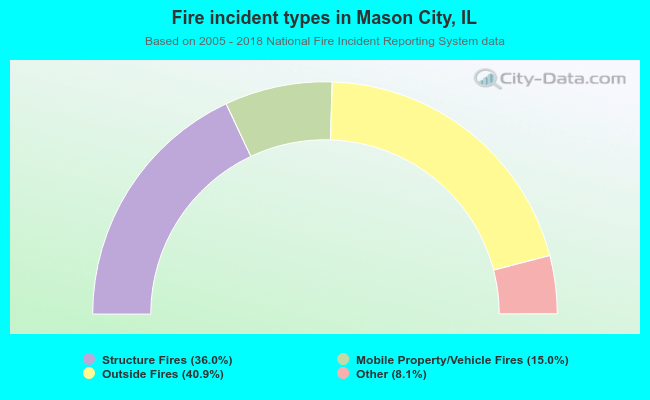 When looking into fire subcategories, the most reports belonged to: Outside Fires (40.9%), and Structure Fires (36.0%).