Mascotte: Fire Incidents, Florida (FL)
Where are fire incidents reported in Mascotte, FL
Something went wrong! Please refresh the page.
|
| |||||||||||||||||||||||||||||||||||||||||||||||||||||||||||||||||||||||||||||||||||||||||||||||||||||||||||||
2002 - 2018 National Fire Incident Reporting System (NFIRS) incidents
- Incident types reported to NFIRS in Mascotte, FL
- 2,76864.3%Rescue & EMS
- 48711.3%Fire
- 44910.4%Good Intent Call
- 2786.5%Hazardous Condition
- 2205.1%Service Call
- 852.0%False Alarm
- 60.1%Severe Weather
- 60.1%Special Incident
- 50.1%Overpressure Rupture
- Fire incident types reported to NFIRS in Mascotte, FL
- 23448.0%Outside Fires
- 17235.3%Structure Fires
- 5511.3%Mobile Property/Vehicle Fires
- 265.3%Other
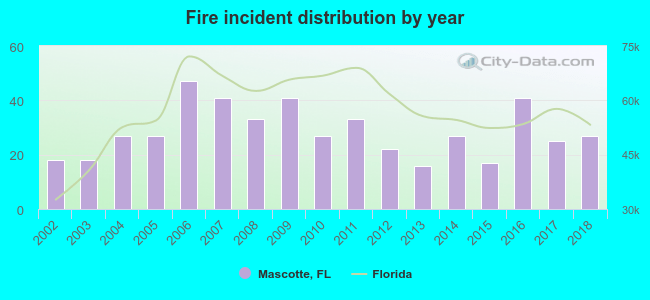 According to the data from the years 2002 - 2018 the average number of fire incidents per year is 29. The highest number of reported fires - 47 took place in 2006, and the least - 16 in 2013. The data has an increasing trend.
The average number of yearly fire incidents per 10k residents in Mascotte, FL compared to nearest cities:
(Note: Based on data for the last 3 years, including only cities with population 5,000 and above)
| Mascotte: | 58.0 |
| Groveland: | 139.3 |
| Minneola: | 39.9 |
| Clermont: | 66.8 |
| Leesburg: | 110.9 |
| Tavares: | 64.1 |
| Winter Garden: | 38.1 |
| Wildwood: | 141.6 |
| Ocoee: | 36.9 |

 28.5% incidents where reported in the morning and 71.5% in the evening. The most fires (18.5%) took place on Tuesday, and the least (11.7%) on Friday.
 Based on the 487 fire incidents from years 2002 - 2018 most fires (11.5%) took place during March, and the least (4.9%) in August.
 Out of all 4,304 cases reported during the years 2002 - 2018, the most belonged to the categories: Rescue & EMS (64.3%), Fire (11.3%), and Good Intent Call (10.4%).
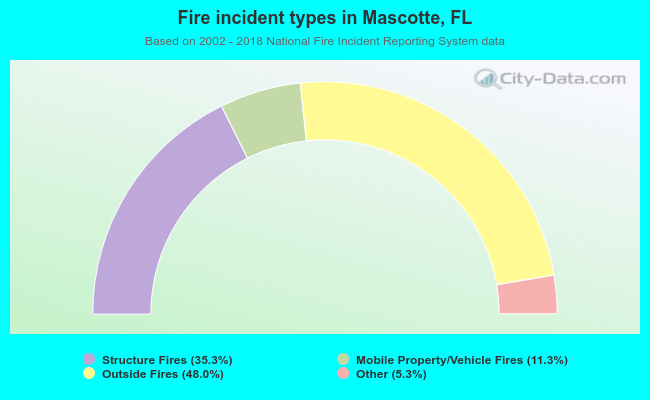 When looking into fire subcategories, the most incidents belonged to: Outside Fires (48.0%), and Structure Fires (35.3%).