Marysville: Fire Incidents, Pennsylvania (PA)
Where are fire incidents reported in Marysville, PA
Something went wrong! Please refresh the page.
|
| |||||||||||||||||||||||||||||||||||||||||||||||||||||||||||||||||||||||||||||||||||||||||||||||||||||||||||||
2005 - 2018 National Fire Incident Reporting System (NFIRS) incidents
- Incident types reported to NFIRS in Marysville, PA
- 19439.8%Fire
- 13227.0%Rescue & EMS
- 7114.5%Hazardous Condition
- 387.8%Good Intent Call
- 173.5%Service Call
- 153.1%Severe Weather
- 122.5%False Alarm
- 91.8%Special Incident
- Fire incident types reported to NFIRS in Marysville, PA
- 12765.5%Structure Fires
- 5226.8%Outside Fires
- 126.2%Mobile Property/Vehicle Fires
- 31.5%Other
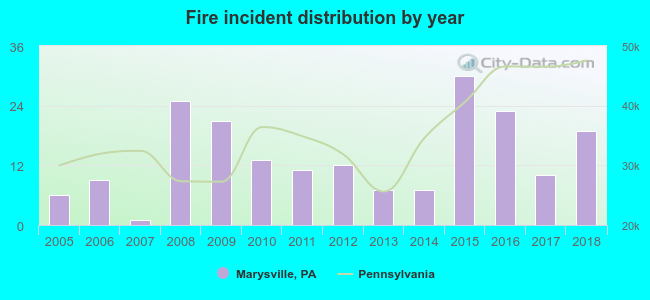 According to the data from the years 2005 - 2018 the average number of fires per year is 14. The highest number of reported fires - 30 took place in 2015, and the least - 1 in 2007. The data has a rising trend.
 38.7% incidents where reported in the morning and 61.3% in the evening. The most fires (22.2%) took place on Sunday, and the least (8.2%) on Friday.
 Based on the 194 fire incidents from years 2005 - 2018 most fires (18.0%) took place during April, and the least (3.6%) in December.
 Out of all 488 cases reported during the years 2005 - 2018, the most belonged to the categories: Fire (39.8%), Overpressure Rupture (27.0%), and Rescue & EMS (14.5%).
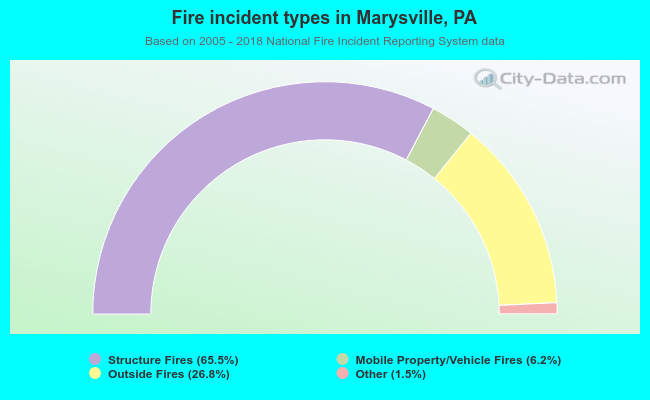 When looking into fire subcategories, the most reports belonged to: Structure Fires (65.5%), and Outside Fires (26.8%).