Martinsburg: Fire Incidents, West Virginia (WV)
Where are fire incidents reported in Martinsburg, WV
Something went wrong! Please refresh the page.
| Fire incidents reported | |
|---|---|
| Sreet name | Count |
| FOXCROFT AVE | 160 |
| WINCHESTER AVE | 156 |
| QUEEN ST | 138 |
| KING ST | 100 |
| INTERSTATE 81 | 62 |
| WILLIAMSPORT PIKE | 56 |
| PORTER AVE | 54 |
| BURKE ST | 50 |
| MARTIN ST | 46 |
| EDWIN MILLER BLVD | 44 |
| RACE ST | 44 |
| HIGH ST | 42 |
| ROCK CLIFF DR | 42 |
| VIRGINIA AVE | 40 |
| JOHN ST | 38 |
| RALEIGH ST | 38 |
| TAVERN RD | 36 |
| MOLER AVE | 34 |
| APPLE HARVEST DR | 32 |
| GOLF COURSE RD | 32 |
| HEDGESVILLE RD | 32 |
| CAPERTON BLVD | 30 |
| DRY RUN RD | 30 |
| STEPHEN ST | 30 |
| TUSCARORA PIKE | 30 |
| SHEPHERDSTOWN RD | 28 |
| WILLIAMSPORT PIKE | 28 |
| BERKELEY STATION ROAD | 26 |
| EAGLE SCHOOL RD | 26 |
| RIDGE RD | 26 |
| Other | 2,030 |
2003 - 2018 National Fire Incident Reporting System (NFIRS) incidents
- Incident types reported to NFIRS in Martinsburg, WV
- 6,66233.5%Rescue & EMS
- 3,56017.9%Fire
- 3,14515.8%Good Intent Call
- 2,86214.4%False Alarm
- 2,69313.6%Hazardous Condition
- 7944.0%Service Call
- 610.3%Overpressure Rupture
- 570.3%Severe Weather
- 250.1%Special Incident
- Fire incident types reported to NFIRS in Martinsburg, WV
- 1,78050.0%Structure Fires
- 1,14132.1%Outside Fires
- 54715.4%Mobile Property/Vehicle Fires
- 922.6%Other
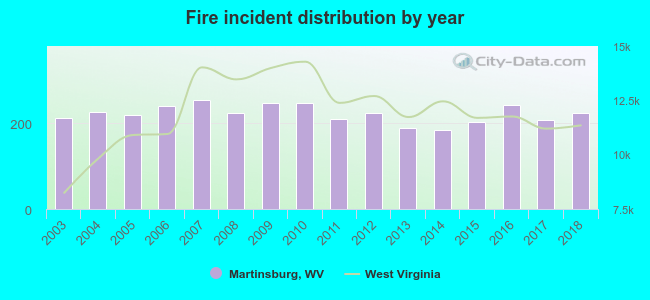 According to the data from the years 2003 - 2018 the average number of fires per year is 223. The highest number of reported fires - 254 took place in 2007, and the least - 185 in 2014. The data has an increasing trend.
The average number of yearly fire incidents per 10k residents in Martinsburg, WV compared to nearest cities:
(Note: Based on data for the last 3 years, including only cities with population 5,000 and above)
| Martinsburg: | 127.4 |
| Charles Town: | 210.3 |
 The median response time based on all reported fire incidents is 7 minutes. This is lower than the state median value.
The median response time in Martinsburg, WV compared to nearest cities:
(Note: Based on data for all years, including only cities with at least 500 fire incidents)
| Martinsburg: | 7 minutes |
| Hedgesville: | 18 minutes |
| Falling Waters: | 14 minutes |
| Inwood: | 10 minutes |
| Shepherdstown: | 11 minutes |
| Sharpsburg: | 9 minutes |
| Williamsport: | 8 minutes |
| Charles Town: | 11 minutes |
| Clear Spring: | 12 minutes |
 According to the reports from the years 2003 - 2018 the average number of fire-related yearly deaths is 1. The highest number of deaths - 7 took place in 2006, and the lowest - 0 in 2005. The data has a growing trend.
The average number of deaths per 1,000 fires is 6. This indicator was the highest - 29 in 2006, and the lowest 0 in 2005. The trend for deaths per 1,000 fires is increasing. Compared to the state value the number of deaths per 1,000 fires is higher.
According to the reports from the years 2003 - 2018 the average number of fire-related yearly deaths is 1. The highest number of deaths - 7 took place in 2006, and the lowest - 0 in 2005. The data has a growing trend.
The average number of deaths per 1,000 fires is 6. This indicator was the highest - 29 in 2006, and the lowest 0 in 2005. The trend for deaths per 1,000 fires is increasing. Compared to the state value the number of deaths per 1,000 fires is higher.Deaths per 1,000 incidents in Martinsburg, WV compared to nearest cities:
(Note: Based on data for all years, including only cities with at least 2,500 fire incidents)
| Martinsburg: | 5.9 |
| Hagerstown: | 2.1 |
| Winchester: | 1.3 |
 According to the reports from the years 2003 - 2018 the average number of fire-related casualties per year is 4. The highest number of injuries - 11 took place in 2009, and the lowest - 0 in 2006. The data has a growing trend.
The average number of injuries per 1,000 fire incidents is 16. This indicator was the highest - 44 in 2009, and the lowest 0 in 2006. The trend for injuries per 1,000 fire incidents is increasing. Compared to the West Virginia value the number of casualties per 1,000 fire incidents is much higher.
According to the reports from the years 2003 - 2018 the average number of fire-related casualties per year is 4. The highest number of injuries - 11 took place in 2009, and the lowest - 0 in 2006. The data has a growing trend.
The average number of injuries per 1,000 fire incidents is 16. This indicator was the highest - 44 in 2009, and the lowest 0 in 2006. The trend for injuries per 1,000 fire incidents is increasing. Compared to the West Virginia value the number of casualties per 1,000 fire incidents is much higher.Casualties per 1,000 incidents in Martinsburg, WV compared to nearest cities:
(Note: Based on data for all years, including only cities with at least 500 fire incidents)
| Martinsburg: | 16.6 |
| Hedgesville: | 1.3 |
| Falling Waters: | 10.6 |
| Inwood: | 5.1 |
| Shepherdstown: | 8.8 |
| Sharpsburg: | 3.0 |
| Williamsport: | 3.6 |
| Charles Town: | 12.8 |
| Clear Spring: | 3.5 |
 32.6% incidents where reported in the morning and 67.4% in the evening. The most fires (16.3%) took place on Sunday, and the least (12.8%) on Monday.
 Based on the 3,560 fires from years 2003 - 2018 most fires (11.3%) took place during April, and the least (6.5%) in September.
 Out of all 19,859 cases reported during the years 2003 - 2018, the most belonged to the categories: Rescue & EMS (33.5%), Fire (17.9%), and Good Intent Call (15.8%).
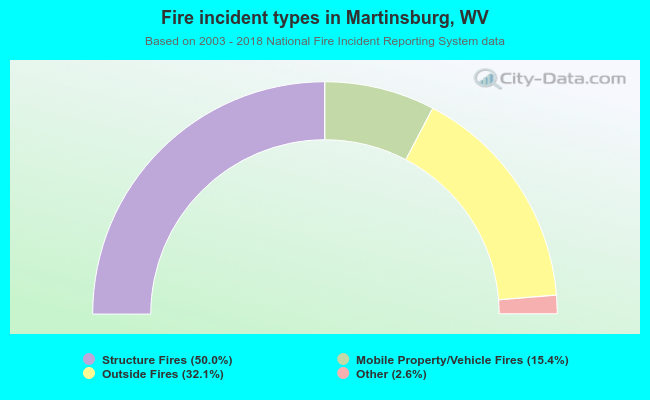 When looking into fire subcategories, the most reports belonged to: Structure Fires (50.0%), and Outside Fires (32.1%).