Marlinton: Fire Incidents, West Virginia (WV)
Where are fire incidents reported in Marlinton, WV
Something went wrong! Please refresh the page.
|
| |||||||||||||||||||||||||||||||||||||||||||||||||||||||||||||||||||||||||||||||||||||||||||||||||||||||||||||
| Other | 73 | |||||||||||||||||||||||||||||||||||||||||||||||||||||||||||||||||||||||||||||||||||||||||||||||||||||||||||||
2005 - 2018 National Fire Incident Reporting System (NFIRS) incidents
- Incident types reported to NFIRS in Marlinton, WV
- 1,19974.1%Rescue & EMS
- 24114.9%Fire
- 1006.2%Hazardous Condition
- 352.2%Good Intent Call
- 241.5%Service Call
- 150.9%False Alarm
- 20.1%Severe Weather
- Fire incident types reported to NFIRS in Marlinton, WV
- 14861.4%Structure Fires
- 6024.9%Outside Fires
- 2711.2%Mobile Property/Vehicle Fires
- 62.5%Other
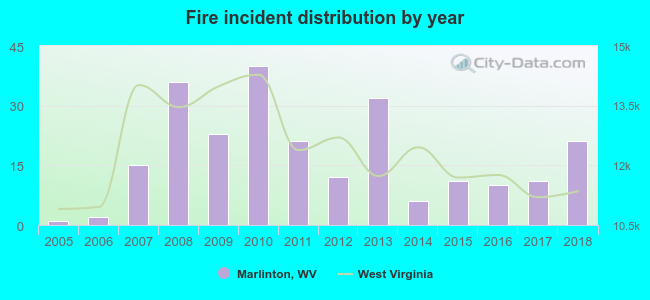 According to the data from the years 2005 - 2018 the average number of fires per year is 17. The highest number of reported fires - 40 took place in 2010, and the least - 1 in 2005. The data has an increasing trend.
 According to the data from the years 2005 - 2018 the average number of fire-related yearly deaths is 0. The highest number of deaths - 2 took place in 2008, and the lowest - 0 in 2005. The data has a constant trend.
 38.2% incidents where reported in the morning and 61.8% in the evening. The most fires (18.7%) took place on Monday, and the least (11.2%) on Tuesday.
 Based on the 241 fire incidents from years 2005 - 2018 most fires (13.7%) took place during January, and the least (2.9%) in August.
 Out of all 1,618 cases reported during the years 2005 - 2018, the most belonged to the categories: Rescue & EMS (74.1%), Fire (14.9%), and Hazardous Condition (6.2%).
 When looking into fire subcategories, the most incidents belonged to: Structure Fires (61.4%), and Outside Fires (24.9%).