| Fire incidents reported |
|---|
| Sreet name | Count |
|---|
| BADLANDS | 24 | | HWY 156 | 6 | | HWY 177 | 6 | | 13701 BADLANDS | 4 | | 15050 ACRE | 4 | | 21700 EAGLENEST | 4 | | 4TH & ANTELOPE | 4 | | 4TH AND DEER | 4 | | 520 N. ELK | 4 | | COUNTY RD 150 AND DAKOTA | 4 | | COWBOY HILL RD | 4 | | DAKOTA | 4 | | LOBO ACRES | 4 | | 1 MI S MARLAND, RR | 2 | | 1/2 E OF 77 ON ACRE RD | 2 | | 1/2 MI N MARLAND HWY 156 E | 2 | | 1/2 N HWY 156 E SIDE OF RD | 2 | | 1/2 N HWY 156, E SIDE OF RD | 2 | | 1/4 N ACRE W OF CR 130 | 2 | | 100 N MAIN | 2 | | 1548 COUNTY RD 240 | 2 | | 205 U ST | 2 | | 20750 DAKOTA | 2 | | 212 N BUFFALO | 2 | | 216 N. COYOTE | 2 |
| | | Fire incidents reported |
|---|
| Sreet name | Count |
|---|
| 22701 ACRE | 2 | | 2351 COUNTY RD 230 | 2 | | 24000 COWBOY RD | 2 | | 2401 COWBOY HILL RD | 2 | | 24701 COWBOY ROAD | 2 | | 29600 BADLANDS | 2 | | 2ND ANTELOPE | 2 | | 3/4 MI W OF HWY 177 ON ACRE | 2 | | 3000 W COWBOY HILL RD | 2 | | 3000 W. COWBOY HILL RD. | 2 | | 30200 BADLANDS | 2 | | 3201 COWBOY HILL RD | 2 | | 3400 W. COWBOY HILL RD | 2 | | 3406 W. COUNTY LINE RD | 2 | | 3500 S. HWY 177 | 2 | | 3RD & ANTELOPE | 2 | | 3RD AND BUFFALO | 2 | | 3RD COYOTE | 2 | | 407 N ELK | 2 | | 420 COYOTE | 2 | | 4600 W. WHITE EAGLE RD. | 2 | | 4TH 7 ANTELOPE | 2 | | 4TH AND ALFALFA | 2 | | 4TH AND BUFFALO | 2 | | |
|
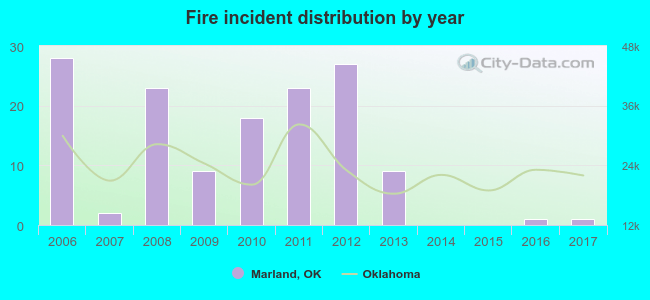 Based on the data from the years 2006 - 2017 the average number of fires per year is 12. The highest number of fires - 28 took place in 2006, and the least - 0 in 2014. The data has a declining trend.
 17.7% incidents where reported in the morning and 82.3% in the evening. The most fires (22.0%) took place on Friday, and the least (7.1%) on Thursday.
 According to the 141 incident reports from years 2006 - 2017 most fires (15.6%) took place during July, and the least (3.5%) in May.
 Out of all 159 cases reported during the years 2006 - 2017, the most belonged to the categories: Fire (88.7%), Overpressure Rupture (8.2%), and Rescue & EMS (3.1%).
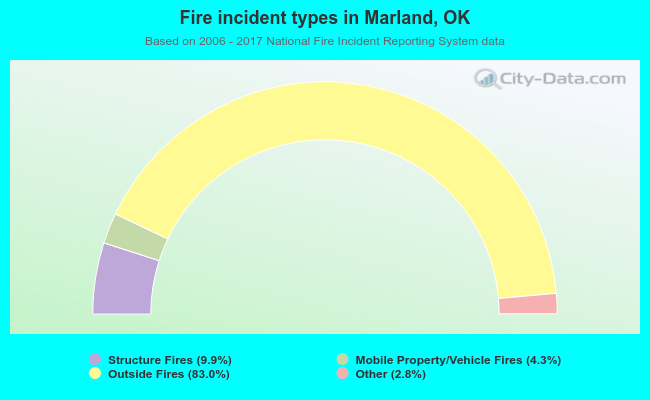 When looking into fire subcategories, the most incidents belonged to: Outside Fires (83.0%), and Structure Fires (9.9%).