| Fire incidents reported |
|---|
| Sreet name | Count |
|---|
| MAIN ST | 24 | | HAMILTON ST | 14 | | MAIN STREET | 14 | | STATE ROUTE 13 | 14 | | PARK ST | 10 | | BESS | 8 | | DOZA CREEK RD | 8 | | GRACE ST | 8 | | GRACE STREET | 8 | | HAMILTON | 8 | | HILLSTOWN ROAD | 8 | | PARK | 8 | | RISDON SCHOOL RD | 8 | | BESS ST | 6 | | BESS STREET | 6 | | EUCLID | 6 | | HAMILTON STREET | 6 | | LENZBURG E. ROAD | 6 | | LYONS ST | 6 | | LYONS STREET | 6 | | MAIN | 6 | | MILL ST | 6 | | MUD CREEK ROAD | 6 | | RANDOLPH COUNTY LINE RD | 6 | | RANGE LANE | 6 |
| | | Fire incidents reported |
|---|
| Sreet name | Count |
|---|
| S. MEEK ST. | 6 | | STATE ROUTE 13 HWY | 6 | | STATE ROUTE 15 | 6 | | WHITE OAK MINE ROAD | 6 | | 116 PINE ST | 4 | | 3690 STATE ROUTE 4 | 4 | | BALDWIN ROAD | 4 | | BECKMAN ROAD | 4 | | BESS AVE | 4 | | BORDERS | 4 | | BORDERS ST | 4 | | COUNTY HIGHWAY 12 | 4 | | COUNTY ROAD 12 HWY | 4 | | COUNTY ROAD 18 | 4 | | EIFF RD | 4 | | EUCLID ST | 4 | | GRACE | 4 | | GREEN ST | 4 | | HILLSTOWN RD | 4 | | ILLINOIS ROUTE 4 HWY | 4 | | MILL STREET | 4 | | NEW ATHENS DARMSTADT ROAD | 4 | | NEW MARIGOLD RD | 4 | | NORTH RAILROAD ST | 4 | | |
|
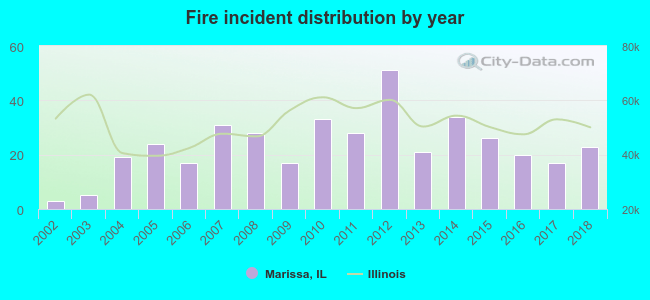 According to the data from the years 2002 - 2018 the average number of fire incidents per year is 23. The highest number of fires - 51 took place in 2012, and the least - 3 in 2002. The data has a growing trend.
 31.5% incidents where reported in the morning and 68.5% in the evening. The most fires (19.6%) took place on Saturday, and the least (10.3%) on Monday.
 According to the 397 fires from years 2002 - 2018 most fires (13.6%) took place during January, and the least (5.8%) in May.
 Out of all 717 cases reported during the years 2002 - 2018, the most belonged to the categories: Fire (55.4%), Hazardous Condition (23.6%), and Rescue & EMS (10.9%).
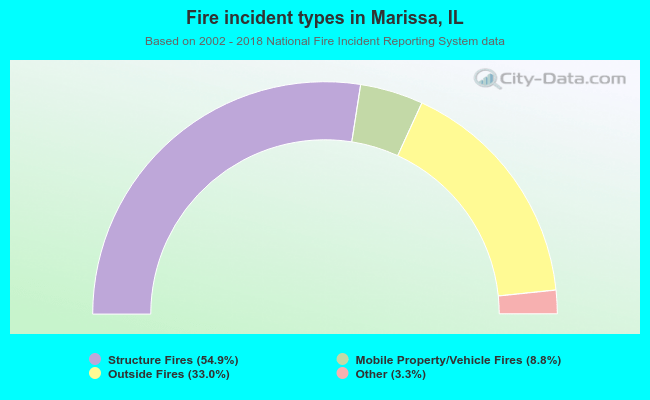 When looking into fire subcategories, the most reports belonged to: Structure Fires (54.9%), and Outside Fires (33.0%).