Marion: Fire Incidents, Michigan (MI)
Where are fire incidents reported in Marion, MI
Something went wrong! Please refresh the page.
|
| |||||||||||||||||||||||||||||||||||||||||||||||||||||||||||||||||||||||||||||||||||||||||||||||||||||||||||||
| Other | 44 | |||||||||||||||||||||||||||||||||||||||||||||||||||||||||||||||||||||||||||||||||||||||||||||||||||||||||||||
2002 - 2018 National Fire Incident Reporting System (NFIRS) incidents
- Incident types reported to NFIRS in Marion, MI
- 35641.7%Rescue & EMS
- 31637.0%Fire
- 9711.4%Hazardous Condition
- 445.2%Special Incident
- 263.0%Good Intent Call
- 121.4%Service Call
- 20.2%False Alarm
- Fire incident types reported to NFIRS in Marion, MI
- 14345.3%Structure Fires
- 12639.9%Outside Fires
- 3511.1%Mobile Property/Vehicle Fires
- 123.8%Other
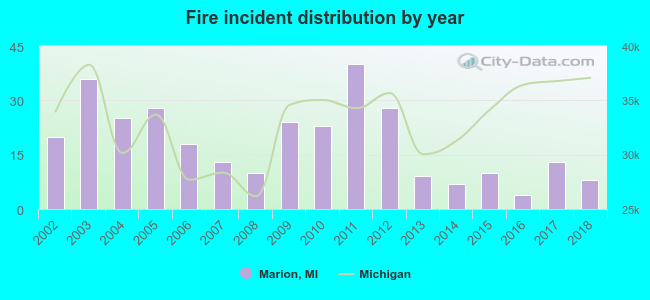 Based on the data from the years 2002 - 2018 the average number of fires per year is 19. The highest number of reported fires - 40 took place in 2011, and the least - 4 in 2016. The data has a decreasing trend.
 23.7% incidents where reported in the morning and 76.3% in the evening. The most fires (19.3%) took place on Saturday, and the least (12.0%) on Tuesday.
 Based on the 316 reports from years 2002 - 2018 most fires (17.1%) took place during April, and the least (2.5%) in September.
 Out of all 853 cases reported during the years 2002 - 2018, the most belonged to the categories: Overpressure Rupture (41.7%), Fire (37.0%), and Rescue & EMS (11.4%).
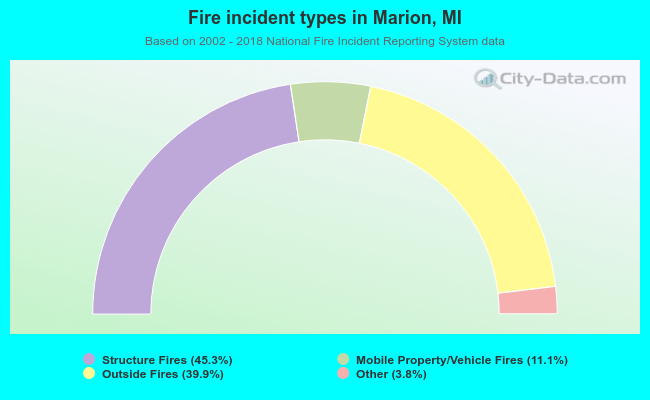 When looking into fire subcategories, the most incidents belonged to: Structure Fires (45.3%), and Outside Fires (39.9%).