Marine City: Fire Incidents, Michigan (MI)
Where are fire incidents reported in Marine City, MI
Something went wrong! Please refresh the page.
|
| |||||||||||||||||||||||||||||||||||||||||||||||||||||||||||||||||||||||||||||||||||||||||||||||||||||||||||||
2002 - 2018 National Fire Incident Reporting System (NFIRS) incidents
- Incident types reported to NFIRS in Marine City, MI
- 1,53852.5%Rescue & EMS
- 44515.2%Fire
- 40513.8%Service Call
- 34411.7%Hazardous Condition
- 782.7%Good Intent Call
- 582.0%Special Incident
- 551.9%False Alarm
- 40.1%Overpressure Rupture
- 40.1%Severe Weather
- Fire incident types reported to NFIRS in Marine City, MI
- 29065.2%Structure Fires
- 8118.2%Outside Fires
- 419.2%Mobile Property/Vehicle Fires
- 337.4%Other
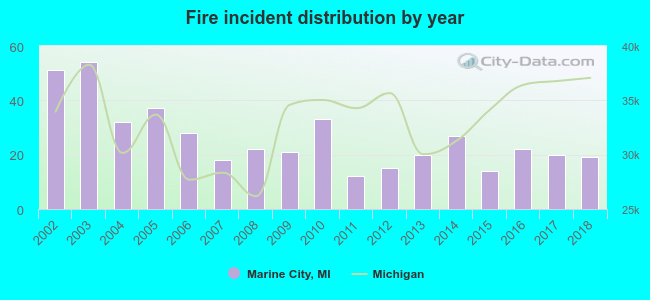 Based on the data from the years 2002 - 2018 the average number of fires per year is 26. The highest number of reported fires - 54 took place in 2003, and the least - 12 in 2011. The data has a decreasing trend.
 35.5% incidents where reported in the morning and 64.5% in the evening. The most fires (19.6%) took place on Friday, and the least (11.9%) on Tuesday.
 Based on the 445 reports from years 2002 - 2018 most fires (11.9%) took place during April, and the least (4.9%) in September.
 Out of all 2,931 cases reported during the years 2002 - 2018, the most belonged to the categories: Rescue & EMS (52.5%), Fire (15.2%), and Service Call (13.8%).
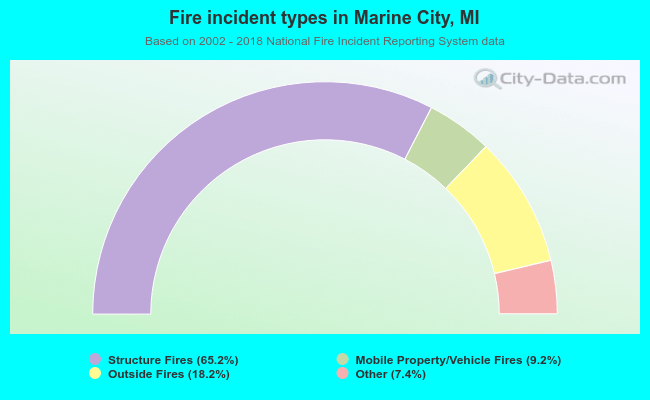 When looking into fire subcategories, the most incidents belonged to: Structure Fires (65.2%), and Outside Fires (18.2%).