Marcellus: Fire Incidents, Michigan (MI)
Where are fire incidents reported in Marcellus, MI
Something went wrong! Please refresh the page.
|
| |||||||||||||||||||||||||||||||||||||||||||||||||||||||||||||||||||||||||||||||||||||||||||||||||||||||||||||
2002 - 2018 National Fire Incident Reporting System (NFIRS) incidents
- Incident types reported to NFIRS in Marcellus, MI
- 35639.0%Fire
- 23325.5%Rescue & EMS
- 17319.0%Hazardous Condition
- 758.2%Good Intent Call
- 434.7%False Alarm
- 161.8%Service Call
- 121.3%Special Incident
- 20.2%Overpressure Rupture
- 20.2%Severe Weather
- Fire incident types reported to NFIRS in Marcellus, MI
- 15744.1%Structure Fires
- 13738.5%Outside Fires
- 349.6%Mobile Property/Vehicle Fires
- 287.9%Other
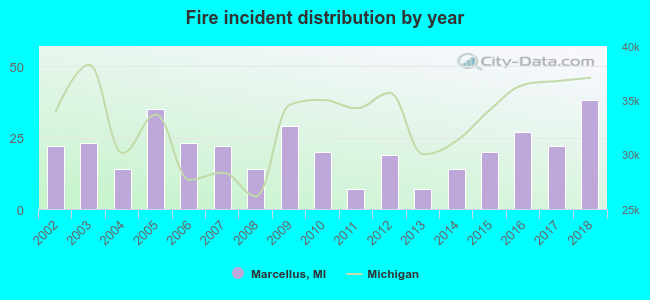 According to the data from the years 2002 - 2018 the average number of fires per year is 21. The highest number of fire incidents - 38 took place in 2018, and the least - 7 in 2011. The data has an increasing trend.
 26.4% incidents where reported in the morning and 73.6% in the evening. The most fires (18.3%) took place on Sunday, and the least (12.4%) on Tuesday.
 Based on the 356 incident reports from years 2002 - 2018 most fires (19.7%) took place during April, and the least (3.4%) in September.
 Out of all 912 cases reported during the years 2002 - 2018, the most belonged to the categories: Fire (39.0%), Rescue & EMS (25.5%), and Hazardous Condition (19.0%).
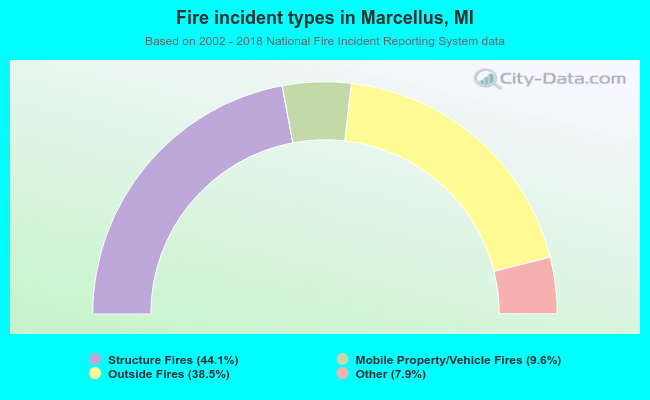 When looking into fire subcategories, the most incidents belonged to: Structure Fires (44.1%), and Outside Fires (38.5%).