Maine: Fire Incidents, New York (NY)
Where are fire incidents reported in Maine, NY
Something went wrong! Please refresh the page.
|
| |||||||||||||||||||||||||||||||||||||||||||||||||||||||||||||||||||||||||||||||||||||||||||||||||||||||||||||
2002 - 2018 National Fire Incident Reporting System (NFIRS) incidents
- Incident types reported to NFIRS in Maine, NY
- 19723.4%Hazardous Condition
- 18521.9%Fire
- 15017.8%Rescue & EMS
- 13816.4%Good Intent Call
- 9110.8%Service Call
- 536.3%False Alarm
- 242.8%Severe Weather
- 40.5%Special Incident
- 10.1%Overpressure Rupture
- Fire incident types reported to NFIRS in Maine, NY
- 10958.9%Structure Fires
- 4624.9%Outside Fires
- 2010.8%Mobile Property/Vehicle Fires
- 105.4%Other
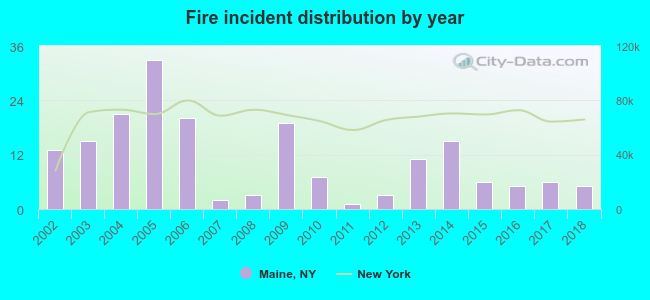 Based on the data from the years 2002 - 2018 the average number of fires per year is 11. The highest number of reported fire incidents - 33 took place in 2005, and the least - 1 in 2011. The data has a declining trend.
The average number of yearly fire incidents per 10k residents in Maine, NY compared to nearest cities:
(Note: Based on data for the last 3 years, including only cities with population 5,000 and above)
| Maine: | 9.9 |
| Endwell: | 21.3 |
| Union: | 1.5 |
| Johnson City: | 42.9 |
| Endicott: | 71.6 |
| Dickinson: | 5.7 |
| Vestal: | 21.3 |
| Binghamton: | 52.5 |
| Fenton: | 1.5 |

 34.6% incidents where reported in the morning and 65.4% in the evening. The most fires (18.4%) took place on Thursday, and the least (10.3%) on Friday.
 Based on the 185 fires from years 2002 - 2018 most fires (17.8%) took place during April, and the least (3.8%) in July.
 Out of all 843 cases reported during the years 2002 - 2018, the most belonged to the categories: Hazardous Condition (23.4%), Fire (21.9%), and Rescue & EMS (17.8%).
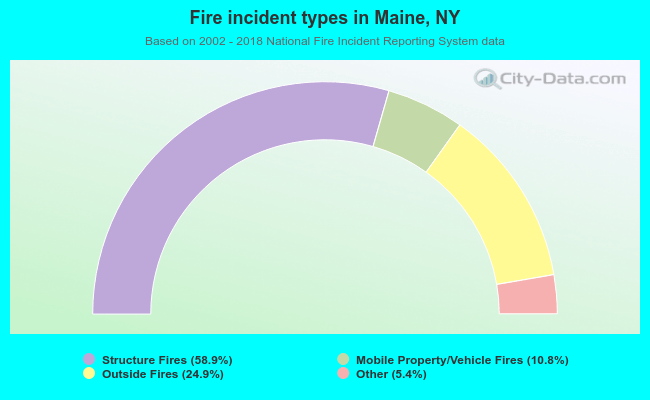 When looking into fire subcategories, the most reports belonged to: Structure Fires (58.9%), and Outside Fires (24.9%).