Madison Heights: Fire Incidents, Virginia (VA)
Where are fire incidents reported in Madison Heights, VA
Something went wrong! Please refresh the page.
| Fire incidents reported | |
|---|---|
| Sreet name | Count |
| AMHERST HWY | 174 |
| GALTS MILL RD | 96 |
| DIXIE AIRPORT RD | 64 |
| ELON RD | 52 |
| MAIN ST | 46 |
| IZAAK WALTON RD | 44 |
| WINESAP RD | 44 |
| RIVER RD | 42 |
| 29 BYPASS | 40 |
| SEMINOLE DR | 34 |
| 29 BUSINESS HWY | 32 |
| COOLWELL RD | 32 |
| KENTMOOR FARM RD | 32 |
| THOMAS RD | 32 |
| WRIGHT SHOP RD | 28 |
| LYNCHS FERRY RD | 26 |
| COLONY RD | 24 |
| AMELON SQ | 22 |
| CEDAR GATE RD | 20 |
| HIGH PEAK RD | 20 |
| AMELON RD | 18 |
| POSSUM ISLAND RD | 18 |
| BRIGHTWELLS MILL RD | 16 |
| GROVE AVE | 16 |
| PHELLPS RD | 16 |
| FATHER JUDGE RD | 14 |
| KINGS RD | 14 |
| WESLEY DR | 14 |
| BRYANT RD | 12 |
| BURGESS RD | 12 |
| Other | 251 |
2003 - 2018 National Fire Incident Reporting System (NFIRS) incidents
- Incident types reported to NFIRS in Madison Heights, VA
- 1,30532.6%Fire
- 91822.9%Hazardous Condition
- 77619.4%Rescue & EMS
- 70217.5%Good Intent Call
- 1573.9%False Alarm
- 1363.4%Service Call
- 60.1%Severe Weather
- Fire incident types reported to NFIRS in Madison Heights, VA
- 59345.4%Structure Fires
- 48537.2%Outside Fires
- 19815.2%Mobile Property/Vehicle Fires
- 292.2%Other
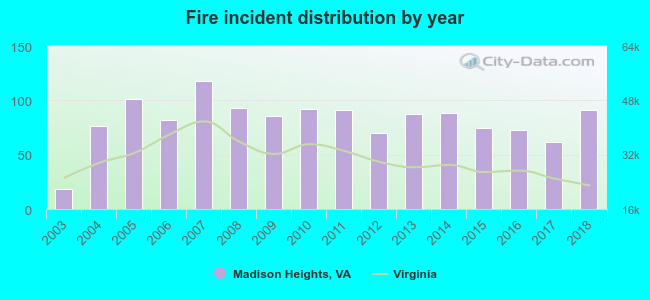 Based on the data from the years 2003 - 2018 the average number of fires per year is 81. The highest number of fires - 118 took place in 2007, and the least - 18 in 2003. The data has a rising trend.
The average number of yearly fire incidents per 10k residents in Madison Heights, VA compared to nearest cities:
(Note: Based on data for the last 3 years, including only cities with population 5,000 and above)
| Madison Heights: | 66.8 |
| Lynchburg: | 28.0 |
| Forest: | 44.3 |
| Timberlake: | 0.8 |
| Bedford: | 163.4 |
| Buena Vista: | 75.7 |
| Lexington: | 145.4 |
| Farmville: | 106.5 |
| Stuarts Draft: | 41.9 |
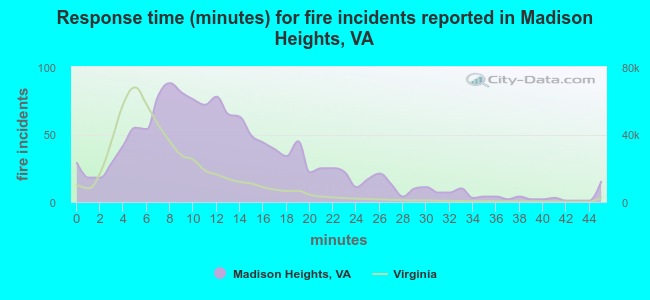 The median response time based on all reported fire incidents is 12 minutes. This is higher compared to the state median value.
The median response time in Madison Heights, VA compared to nearest cities:
(Note: Based on data for all years, including only cities with at least 500 fire incidents)
| Madison Heights: | 12 minutes |
| Lynchburg: | 5 minutes |
| Forest: | 9 minutes |
| Amherst: | 15 minutes |
| Rustburg: | 10 minutes |
| Appomattox: | 12 minutes |
| Bedford: | 10 minutes |
| Buena Vista: | 10 minutes |
| Hurt: | 12 minutes |
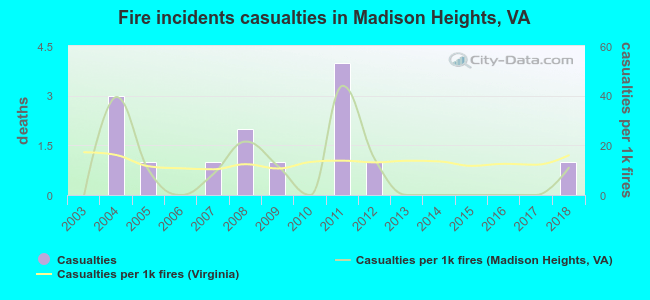 Based on the data from the years 2003 - 2018 the average number of fire-related casualties per year is 1. The highest number of injuries - 4 took place in 2011, and the lowest - 0 in 2003. The data has an increasing trend.
The average number of injuries per 1,000 fire incidents is 10. This indicator was the highest - 44 in 2011, and the lowest 0 in 2003. The trend for injuries per 1,000 fires is rising. Compared to the Virginia value the number of injuries per 1,000 fires is lower.
Based on the data from the years 2003 - 2018 the average number of fire-related casualties per year is 1. The highest number of injuries - 4 took place in 2011, and the lowest - 0 in 2003. The data has an increasing trend.
The average number of injuries per 1,000 fire incidents is 10. This indicator was the highest - 44 in 2011, and the lowest 0 in 2003. The trend for injuries per 1,000 fires is rising. Compared to the Virginia value the number of injuries per 1,000 fires is lower.Casualties per 1,000 incidents in Madison Heights, VA compared to nearest cities:
(Note: Based on data for all years, including only cities with at least 500 fire incidents)
| Madison Heights: | 10.7 |
| Lynchburg: | 14.3 |
| Forest: | 1.1 |
| Amherst: | 0.8 |
| Rustburg: | 2.3 |
| Appomattox: | 0.0 |
| Bedford: | 1.5 |
| Buena Vista: | 2.1 |
| Hurt: | 1.7 |
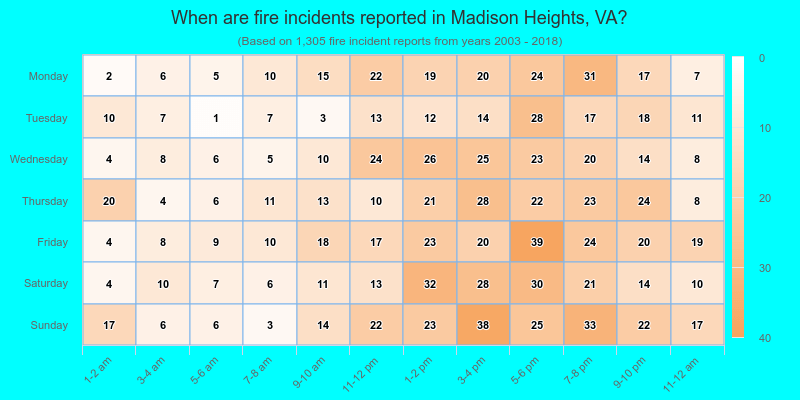
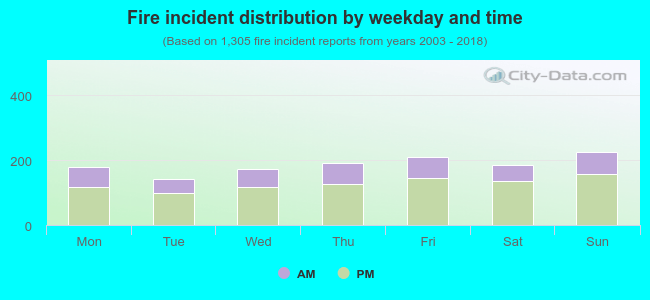 31.2% incidents where reported in the morning and 68.8% in the evening. The most fires (17.3%) took place on Sunday, and the least (10.8%) on Tuesday.
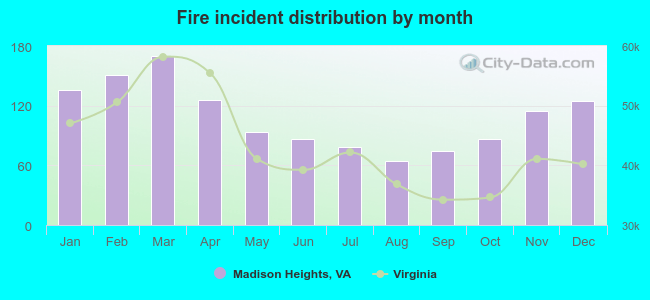 According to the 1,305 incident reports from years 2003 - 2018 most fires (13.0%) took place during March, and the least (4.9%) in August.
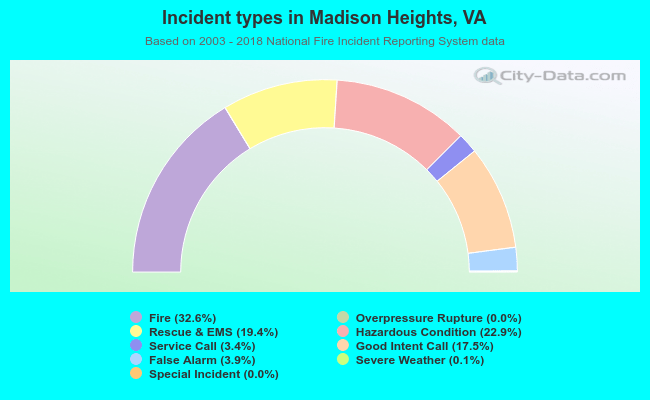 Out of all 4,002 cases reported during the years 2003 - 2018, the most belonged to the categories: Fire (32.6%), Hazardous Condition (22.9%), and Rescue & EMS (19.4%).
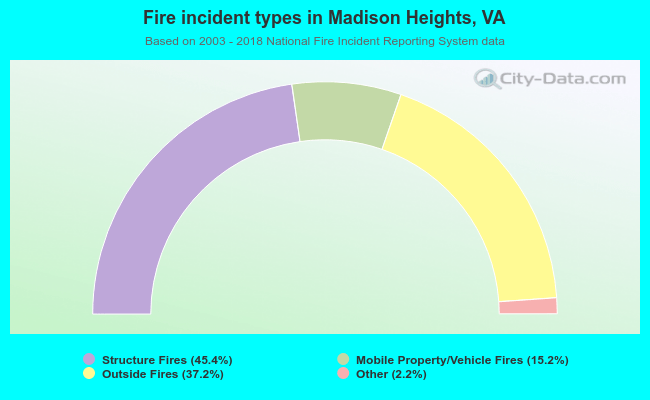 When looking into fire subcategories, the most incidents belonged to: Structure Fires (45.4%), and Outside Fires (37.2%).