| Fire incidents reported |
|---|
| Sreet name | Count |
|---|
| MAIN ST | 42 | | BROOKSIDE RD | 26 | | HILLCREST DR | 22 | | WALKER (86) RD | 22 | | HUNT DR | 18 | | ALBURTIS RD | 16 | | INDIAN CREEK RD | 14 | | ROUTE 100 | 12 | | HAUSER RD | 10 | | 100 RT | 8 | | ASTER RD | 8 | | BROOKFIELD CIR | 8 | | CHURCH ST | 8 | | DOE MOUNTAIN (86) LA | 8 | | PIONEER DR | 8 | | SEISHOLTZVILLE RD | 8 | | SPRING CREEK RD | 8 | | SPRING RIDGE DR | 8 | | BUTTERCUP RD | 6 | | HADDON DR | 6 | | LEHIGH ST | 6 | | LOWER MACUNGIE RD | 6 | | MANSFIELD (86) DR | 6 | | MOUNTAIN VILLAGE DR | 6 | | SWEETWOOD DR | 6 |
| | | Fire incidents reported |
|---|
| Sreet name | Count |
|---|
| VILLAGE WALK DR | 6 | | WALKER RD | 6 | | WALKER86 RD | 6 | | ALEXANDER DR | 4 | | ARONIMINK PL | 4 | | BARBARA DR | 4 | | BARRINGTON86 RD | 4 | | BENFIELD86 RD | 4 | | BRIARWOOD DR | 4 | | BUCK HILL (86) LN | 4 | | BUCKEYE RD | 4 | | CHURCH ST | 4 | | DAISY CIR | 4 | | DOE MOUNTAIN LN | 4 | | EAST TEXAS RD | 4 | | GAP (86) RD | 4 | | GREEN HILL DR | 4 | | HADDAN DR | 4 | | HAUSER DR | 4 | | HAYDT LN | 4 | | HICKORY ST | 4 | | LINCOLN DR | 4 | | MAIN (MACB) ST | 4 | | MOUNTAIN RD | 4 | | |
|
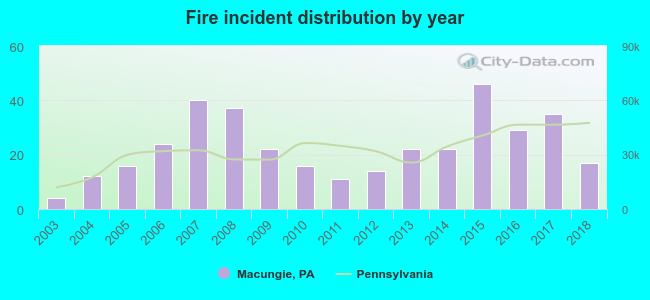 According to the data from the years 2003 - 2018 the average number of fire incidents per year is 23. The highest number of reported fires - 46 took place in 2015, and the least - 4 in 2003. The data has a rising trend.
 32.2% incidents where reported in the morning and 67.8% in the evening. The most fires (16.3%) took place on Sunday, and the least (11.4%) on Tuesday.
 According to the 367 incident reports from years 2003 - 2018 most fires (14.7%) took place during April, and the least (5.2%) in June.
 Out of all 1,652 cases reported during the years 2003 - 2018, the most belonged to the categories: Hazardous Condition (27.3%), Fire (22.2%), and False Alarm (18.6%).
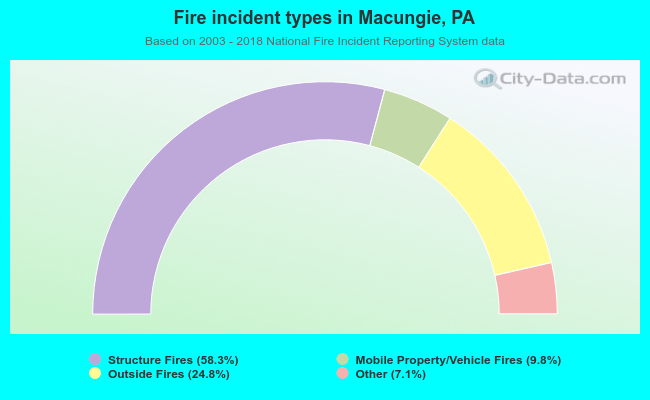 When looking into fire subcategories, the most incidents belonged to: Structure Fires (58.3%), and Outside Fires (24.8%).