| Fire incidents reported |
|---|
| Sreet name | Count |
|---|
| SPRUCE ST | 12 | | HILL ST | 8 | | 411 MILLSTONE DR | 6 | | CHESTNUT ST | 6 | | SPRUCE ST. | 6 | | 201 LESTER ST | 4 | | 201 SIMPSON ST. | 4 | | 311 SPRUCE ST | 4 | | 500 WHITESTICK ST. | 4 | | ARROW LN | 4 | | BECKLEY JUNCTION | 4 | | I77 M 40 SOUTH | 4 | | LANE AVE | 4 | | OLD MILL RD | 4 | | 100 GRIST MILL DR. | 2 | | 102 SPRUCE ST. | 2 | | 103 AMBER DR | 2 | | 104 PINE ST | 2 | | 104 SIMPSON ST | 2 | | 107 PINE ST | 2 | | 107 WARD ST | 2 | | 110 DEPOT ST | 2 | | 110 WILEY ST | 2 | | 110 WILEY ST. | 2 | | 111 SPRUCE ST. | 2 |
| | | Fire incidents reported |
|---|
| Sreet name | Count |
|---|
| 112 LOFLIN ST | 2 | | 118 SPARACINO ST. | 2 | | 128 SOUTH HILL ST. | 2 | | 128 VISION ST | 2 | | 131 CLIFFORD DR. | 2 | | 133 BRANCH ST | 2 | | 147 WHITESTICK ST | 2 | | 163 LEE ST | 2 | | 179 ARROW LN | 2 | | 203 N HILL ST | 2 | | 203 SIMPSON ST | 2 | | 204 SIMPSON ST. | 2 | | 205 SPRUCE ST | 2 | | 209 DOGWOOD CT | 2 | | 209 N HILL ST | 2 | | 210 SPRUCE ST. | 2 | | 212 LANE AVE. | 2 | | 214 WHITESTICK ST | 2 | | 215 SPRUCE ST | 2 | | 217 WHITESTICK ST | 2 | | 218 SPRUCE ST | 2 | | 218 SPRUCE SR | 2 | | 218 SPRUCE ST | 2 | | 221 NORTH HILL ST. | 2 | | 230 KIRK ST | 2 |
|
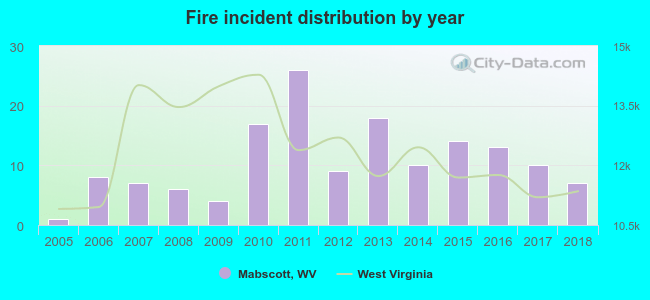 Based on the data from the years 2005 - 2018 the average number of fire incidents per year is 11. The highest number of reported fire incidents - 26 took place in 2011, and the least - 1 in 2005. The data has a growing trend.
 36.7% incidents where reported in the morning and 63.3% in the evening. The most fires (20.0%) took place on Monday, and the least (11.3%) on Tuesday.
 According to the 150 reports from years 2005 - 2018 most fires (12.7%) took place during September, and the least (4.0%) in August.
 Out of all 431 cases reported during the years 2005 - 2018, the most belonged to the categories: Fire (34.8%), Hazardous Condition (23.7%), and Rescue & EMS (17.9%).
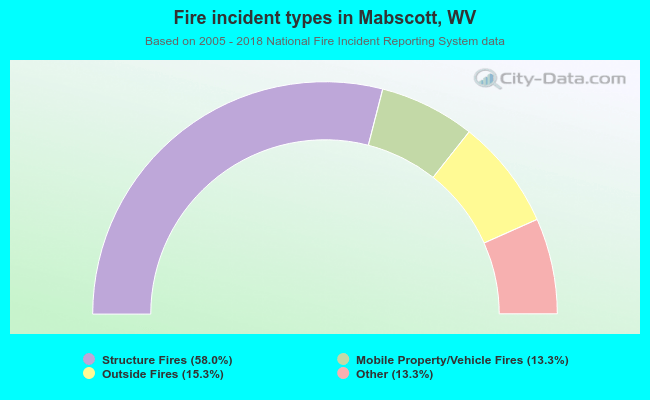 When looking into fire subcategories, the most incidents belonged to: Structure Fires (58.0%), and Outside Fires (15.3%).