| Fire incidents reported |
|---|
| Sreet name | Count |
|---|
| CO RD 29 | 43 | | CO RD 339 | 29 | | CO RD 367 | 23 | | CO RD 59 | 23 | | HWY 5 | 23 | | CO RD 70 | 20 | | 1131 CR9 | 15 | | 2549 CO RD 9 | 15 | | 5119 CO RD 29 | 15 | | CO RD 350 | 15 | | CO RD 9 | 13 | | 1565 CO RD 59 | 10 | | 415 PEACEFUL ACRES | 10 | | 531 EAST MAIN STREET | 10 | | 650 LONG ST. | 10 | | 8371 CR25 | 10 | | CO RD 1 | 10 | | HWY 278 | 10 | | CO RD 25 | 9 | | 715 CR 385 | 8 | | CO. RD 9 | 8 | | 1000 BLOCK CR29 | 5 | | 1 M E F CO RD 25 | 5 | | 1 MILE DN CO RD 351 ON LEFT | 5 | | 1000 BLK OF CO RD 59 | 5 |
| | | Fire incidents reported |
|---|
| Sreet name | Count |
|---|
| 1010 C.R 385 | 5 | | 10379 CR 17 | 5 | | 10427 CR 17 | 5 | | 105 DICKENSON RD | 5 | | 1067 CO RD 3501 | 5 | | 108 PEACEFUL ACRES | 5 | | 116 CR 3610 | 5 | | 1163 CR9 | 5 | | 11700 CO RD 25 | 5 | | 1177 WEST MAIN ST | 5 | | 1177 WEST MAIN ST. | 5 | | 118 CO RD 304 | 5 | | 11860 CR23 | 5 | | 1215 CO RD 1 | 5 | | 1240 CR 59 | 5 | | 13063 CO RD 25 | 5 | | 131 CO RD 369 | 5 | | 131 OLD LYNN ROAD | 5 | | 14 MILE PAST MILLSTONE MTN CH | 5 | | 1434 CO RD 9 | 5 | | 1443 WEST MAIN ST | 5 | | 1556 CR. 1 | 5 | | 175 INDUS DR | 5 | | 17696 | 5 | | |
|
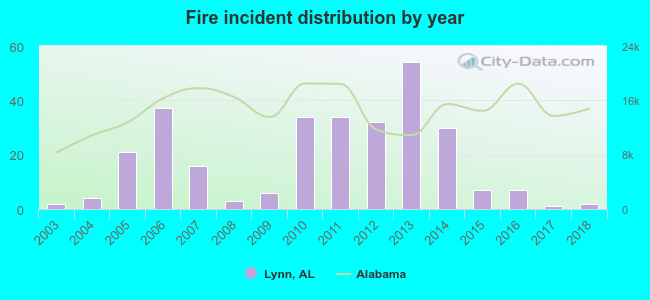 According to the data from the years 2003 - 2018 the average number of fire incidents per year is 18. The highest number of reported fire incidents - 54 took place in 2013, and the least - 1 in 2017. The data has a constant trend.
 28.6% incidents where reported in the morning and 71.4% in the evening. The most fires (23.1%) took place on Saturday, and the least (9.7%) on Monday.
 Based on the 290 fire incident reports from years 2003 - 2018 most fires (16.2%) took place during March, and the least (3.4%) in August.
 Out of all 621 cases reported during the years 2003 - 2018, the most belonged to the categories: Fire (46.7%), Overpressure Rupture (42.8%), and Rescue & EMS (6.9%).
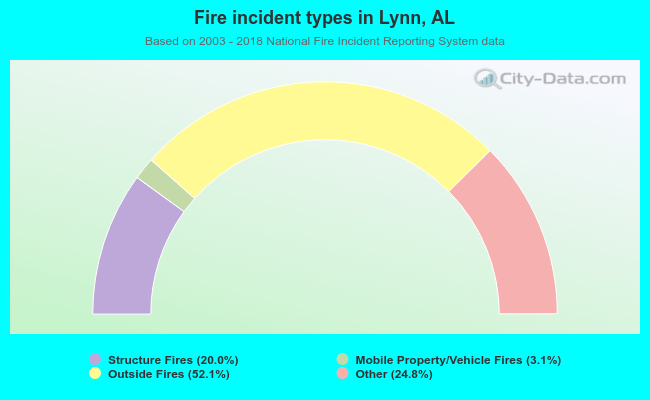 When looking into fire subcategories, the most reports belonged to: Outside Fires (52.1%), and Other (24.8%).