| Fire incidents reported |
|---|
| Sreet name | Count |
|---|
| MCGOFF HILL RD | 64 | | MAIN ST | 36 | | RED VILLAGE RD | 32 | | CENTER ST | 26 | | LOWER CAMPUS RD | 26 | | LYNBURKE RD | 20 | | BACK CENTER RD | 16 | | CHARLES ST | 16 | | BROAD ST | 14 | | MATHEWSON HILL RD | 14 | | MATTY HOUSE CIR | 14 | | DEPOT ST | 12 | | COTTON RD | 10 | | HILL ST | 10 | | MEMORIAL DR | 10 | | RED VILLAGE ROAD | 10 | | VAIL DR | 10 | | VAIL DRIVE DR | 10 | | COLLEGE RD | 8 | | DEER RUN LN | 8 | | GROVE ST | 8 | | LILY POND RD | 8 | | MAIN | 8 | | PUDDING HILL RD | 8 | | BACK CENTER ROAD | 6 |
| | | Fire incidents reported |
|---|
| Sreet name | Count |
|---|
| BROAD STREET | 6 | | EAST BURKE RD | 6 | | KING DR | 6 | | LYNBURKE ROAD | 6 | | MINISTER HILL | 6 | | MT HUNGAR RD | 6 | | PINEHURST ST | 6 | | SOUTH ST | 6 | | SPEEDWELL DR | 6 | | VAIL DRIVE | 6 | | BLUEBIRD LN | 4 | | BURRINGTON BRIDGE RD | 4 | | BURRINGTON BRIDGE ROAD | 4 | | CHURCH ST | 4 | | DIAMOND HILL RD | 4 | | GILMAN RD | 4 | | GRIMES RD | 4 | | HERON LANE | 4 | | JEWELL HILL | 4 | | LITTLE EGYPT RD | 4 | | MADDOX PARK LN | 4 | | MEMORIAL DRIVE | 4 | | MIDDLE ST | 4 | | OLD COACH ROAD | 4 | | |
|
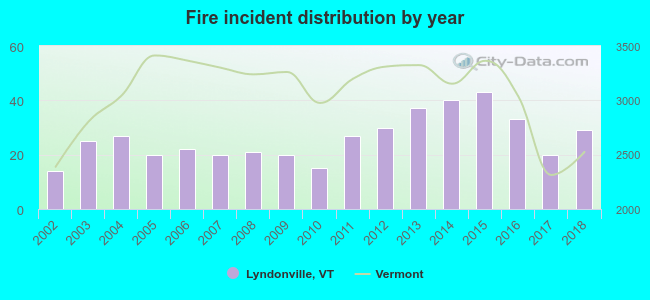 According to the data from the years 2002 - 2018 the average number of fires per year is 26. The highest number of reported fires - 43 took place in 2015, and the least - 14 in 2002. The data has an increasing trend.
 36.3% incidents where reported in the morning and 63.7% in the evening. The most fires (18.5%) took place on Tuesday, and the least (11.5%) on Saturday.
 Based on the 443 fire incidents from years 2002 - 2018 most fires (12.0%) took place during April, and the least (4.5%) in June.
 Out of all 2,003 cases reported during the years 2002 - 2018, the most belonged to the categories: Hazardous Condition (50.1%), Fire (22.1%), and False Alarm (9.4%).
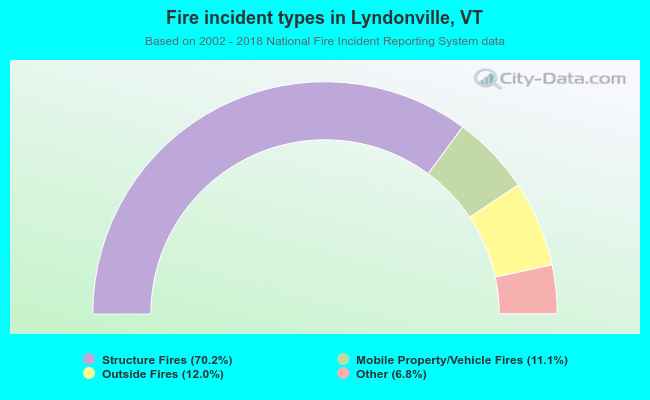 When looking into fire subcategories, the most incidents belonged to: Structure Fires (70.2%), and Outside Fires (12.0%).