| Fire incidents reported |
|---|
| Sreet name | Count |
|---|
| INTERSTATE 88 | 12 | | MOLINE ROAD | 10 | | I88 MILE MARKER 27 | 6 | | 10861 YAGER ROAD | 4 | | 4TH STREET WEST | 4 | | 6TH STREET | 4 | | 7970 BISHOP ROAD | 4 | | I88 MILE MARKER 32 | 4 | | MOHAWK ROAD | 4 | | OAK DRIVE CT | 4 | | 1 ST. ST | 2 | | 104 W 2ND ST | 2 | | 104 W2ND ST | 2 | | 10861 YAGER RD | 2 | | 110 EAST COMMERCIAL STREET | 2 | | 15640 MOHAWK ROAD | 2 | | 17420 CEADER LANE | 2 | | 17431 MAPLE LANE | 2 | | 17660 MOLINE ROAD | 2 | | 18031 MOLINE ROAD | 2 | | 18151 MOLI | 2 | | 18151 MOLINE ROAD | 2 | | 18736 MOLINE ROAD | 2 | | 1ST AVE NORTH | 2 | | 2 ND. ST. ST | 2 |
| | | Fire incidents reported |
|---|
| Sreet name | Count |
|---|
| 201 5TH AVE WEST | 2 | | 202 EAST 2ND STREET | 2 | | 203 3RD AVE W | 2 | | 203 3RD AVE WEST | 2 | | 203 WEST 2ND AVE | 2 | | 20510 JANSON ROAD | 2 | | 20595 MOLINE ROAD | 2 | | 208 EAST 4TH STREET | 2 | | 2AVE | 2 | | 309 2ND AVE WEST | 2 | | 312 WEST 4TH AVE | 2 | | 3RD STREET | 2 | | 401 1ST AVE | 2 | | 409 EAST COMMERCIAL STREET | 2 | | 4TH AVE | 2 | | 4TH AVE | 2 | | 4TH ST | 2 | | 4TH STREET AND 4TH AVE | 2 | | 505 2ND STREET WEST | 2 | | 508 1ST STREET NORTH | 2 | | 602 COMMERCIAL STREET | 2 | | 606 WEST 3 STREET | 2 | | 6TH AVE | 2 | | 702 COMMERCIAL STREET | 2 | | |
|
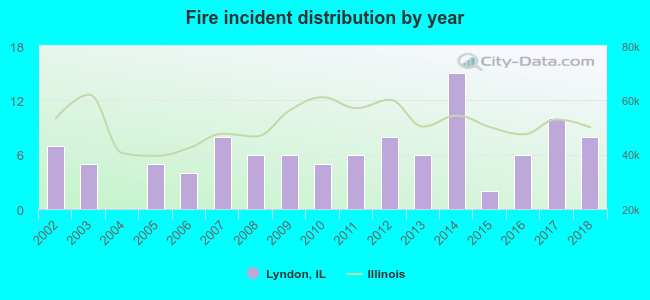 According to the data from the years 2002 - 2018 the average number of fire incidents per year is 6. The highest number of fires - 15 took place in 2014, and the least - 0 in 2004. The data has a growing trend.
 35.5% incidents where reported in the morning and 64.5% in the evening. The most fires (22.4%) took place on Sunday, and the least (10.3%) on Monday.
 Based on the 107 incident reports from years 2002 - 2018 most fires (16.8%) took place during April, and the least (0.9%) in August.
 Out of all 358 cases reported during the years 2002 - 2018, the most belonged to the categories: Overpressure Rupture (52.0%), Fire (29.9%), and Rescue & EMS (12.0%).
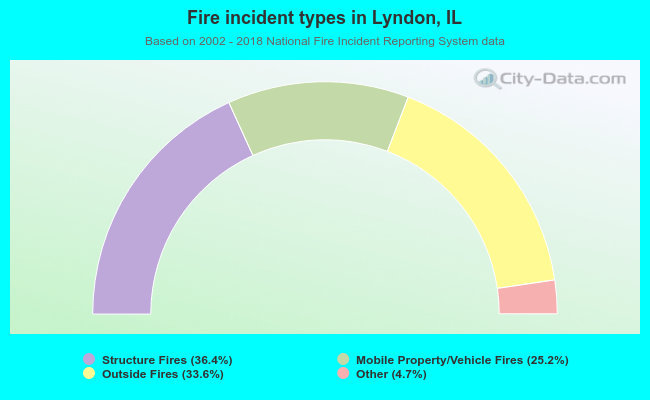 When looking into fire subcategories, the most incidents belonged to: Structure Fires (36.4%), and Outside Fires (33.6%).