Lyman: Fire Incidents, Wyoming (WY)
Where are fire incidents reported in Lyman, WY
Something went wrong! Please refresh the page.
|
| |||||||||||||||||||||||||||||||||||||||||||||||||||||||||||||||||||||||||||||||||||||||||||||||||||||||||||||
2002 - 2018 National Fire Incident Reporting System (NFIRS) incidents
- Incident types reported to NFIRS in Lyman, WY
- 43144.5%Fire
- 28229.1%Rescue & EMS
- 13213.6%Hazardous Condition
- 606.2%Good Intent Call
- 303.1%False Alarm
- 202.1%Service Call
- 111.1%Special Incident
- 10.1%Overpressure Rupture
- 10.1%Severe Weather
- Fire incident types reported to NFIRS in Lyman, WY
- 21449.7%Outside Fires
- 10023.2%Mobile Property/Vehicle Fires
- 9221.3%Structure Fires
- 255.8%Other
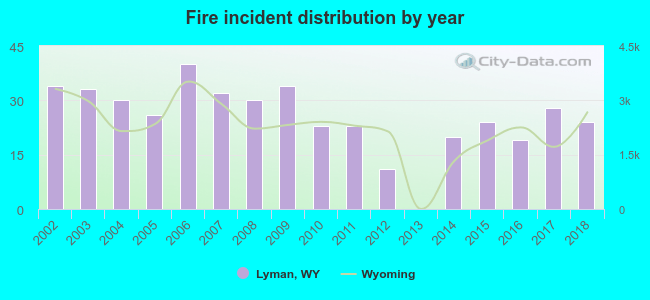 According to the data from the years 2002 - 2018 the average number of fire incidents per year is 25. The highest number of reported fires - 40 took place in 2006, and the least - 0 in 2013. The data has a dropping trend.
 According to the data from the years 2002 - 2018 the average number of fire-related casualties per year is 0. The highest number of injuries - 1 took place in 2003, and the lowest - 0 in 2002. The data has a constant trend.
 30.4% incidents where reported in the morning and 69.6% in the evening. The most fires (17.9%) took place on Saturday, and the least (12.3%) on Sunday.
 Based on the 431 fires from years 2002 - 2018 most fires (15.1%) took place during July, and the least (4.6%) in February.
 Out of all 968 cases reported during the years 2002 - 2018, the most belonged to the categories: Fire (44.5%), Rescue & EMS (29.1%), and Hazardous Condition (13.6%).
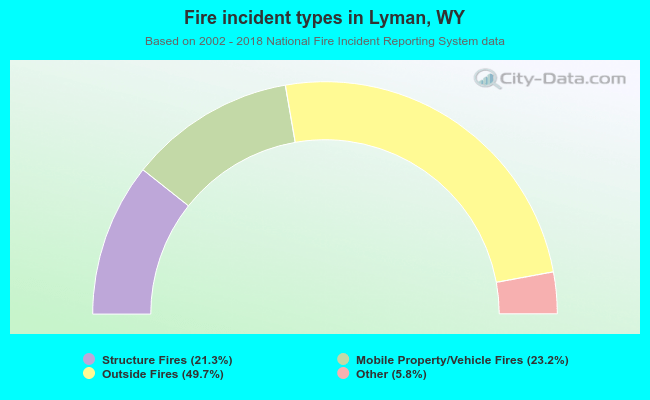 When looking into fire subcategories, the most reports belonged to: Outside Fires (49.7%), and Mobile Property/Vehicle Fires (23.2%).