Lykens: Fire Incidents, Pennsylvania (PA)
Where are fire incidents reported in Lykens, PA
Something went wrong! Please refresh the page.
|
| |||||||||||||||||||||||||||||||||||||||||||||||||||||||||||||||||||||||||||||||||||||||||||||||||||||||||||||
2003 - 2018 National Fire Incident Reporting System (NFIRS) incidents
- Incident types reported to NFIRS in Lykens, PA
- 12231.9%Fire
- 8923.3%Rescue & EMS
- 5313.9%Hazardous Condition
- 5013.1%Service Call
- 389.9%Good Intent Call
- 297.6%False Alarm
- 10.3%Overpressure Rupture
- Fire incident types reported to NFIRS in Lykens, PA
- 8872.1%Structure Fires
- 2419.7%Outside Fires
- 64.9%Mobile Property/Vehicle Fires
- 43.3%Other
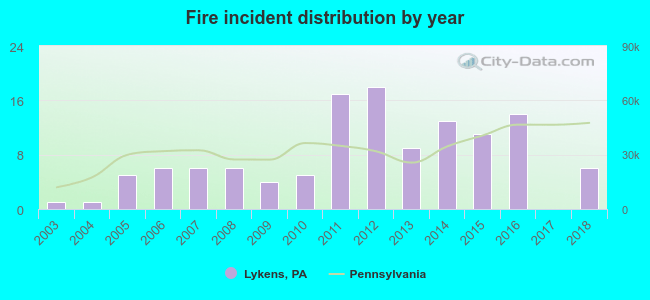 According to the data from the years 2003 - 2018 the average number of fire incidents per year is 8. The highest number of reported fires - 18 took place in 2012, and the least - 0 in 2017. The data has a rising trend.
 31.1% incidents where reported in the morning and 68.9% in the evening. The most fires (17.2%) took place on Monday, and the least (9.0%) on Sunday.
 According to the 122 incident reports from years 2003 - 2018 most fires (15.6%) took place during March, and the least (4.1%) in October.
 Out of all 382 cases reported during the years 2003 - 2018, the most belonged to the categories: Fire (31.9%), Rescue & EMS (23.3%), and Hazardous Condition (13.9%).
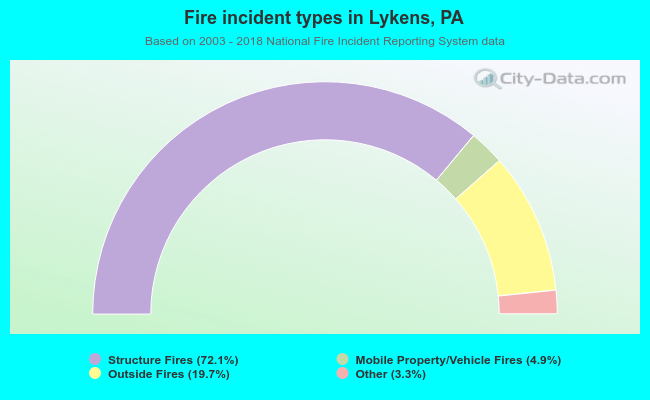 When looking into fire subcategories, the most incidents belonged to: Structure Fires (72.1%), and Outside Fires (19.7%).