| Fire incidents reported |
|---|
| Sreet name | Count |
|---|
| LUXEMBURG FIRE | 16 | | AB HWY | 8 | | RIVER ROAD | 8 | | 29 HWY | 6 | | CHERNEYVILLE RD | 6 | | E0838 CTH N | 6 | | HILL RD | 6 | | JAHNKE RD | 6 | | LECAPTAIN RD | 6 | | MAIN ST | 6 | | AB RD | 4 | | BADER RD | 4 | | BORLEY LN | 4 | | CANYON CREEK | 4 | | CANYON CREEK LN | 4 | | CH N | 4 | | COUNTY X | 4 | | CTH F | 4 | | CTH S | 4 | | E1844 BELTER RD | 4 | | FOURTH ST | 4 | | GASCHE RD | 4 | | HILLVIEW RD | 4 | | LUXEMBURG FIRE DEPT | 4 | | PINE GROVE RD | 4 |
| | | Fire incidents reported |
|---|
| Sreet name | Count |
|---|
| STATE HWY 54 | 4 | | VALLEY RD | 4 | | VALLEY RD | 4 | | 111 MAIN ST | 2 | | 111 NORTH MAIN ST | 2 | | 112 4TH STREET | 2 | | 112 ROCKY RD | 2 | | 1207 MAIN ST | 2 | | 1350 SOUTH SUGARBUSH RD | 2 | | 1757 CHERNEYVILLE RD | 2 | | 1812 WOODHAVEN CT | 2 | | 207 1ST STREET | 2 | | 2078 LA CAPTAIN RD | 2 | | 2515 CTY HWY AB | 2 | | 29 | 2 | | 306 CHURCH RD | 2 | | 336 HILLVIEW ST | 2 | | 4TH ST | 2 | | 513 12 MAIN ST | 2 | | 57 RD | 2 | | 5717 LUXEMBURG RD | 2 | | 5907 HUMBOLDT RD | 2 | | 6049 HE TOWNLINE RD | 2 | | 6265 TIELENS ROAD | 2 | | A AND LUXEMBURG XRD | 2 |
|
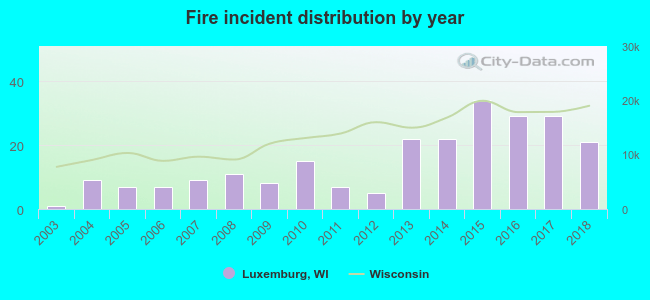 According to the data from the years 2003 - 2018 the average number of fires per year is 15. The highest number of reported fire incidents - 34 took place in 2015, and the least - 1 in 2003. The data has an increasing trend.
 30.5% incidents where reported in the morning and 69.5% in the evening. The most fires (18.2%) took place on Friday, and the least (8.9%) on Thursday.
 According to the 236 fire incidents from years 2003 - 2018 most fires (15.7%) took place during December, and the least (4.7%) in October.
 Out of all 506 cases reported during the years 2003 - 2018, the most belonged to the categories: Fire (46.6%), Overpressure Rupture (24.5%), and Rescue & EMS (10.7%).
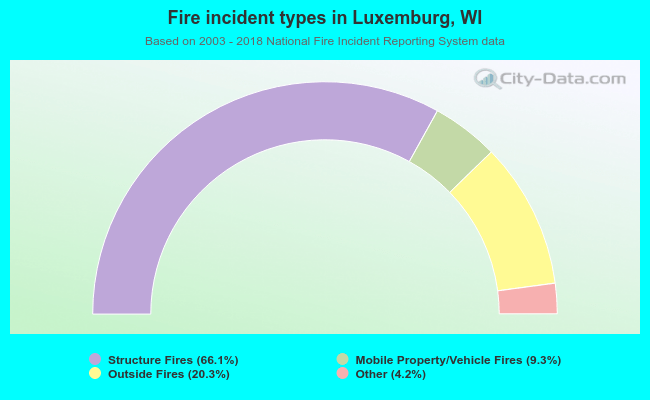 When looking into fire subcategories, the most incidents belonged to: Structure Fires (66.1%), and Outside Fires (20.3%).