Luna Pier: Fire Incidents, Michigan (MI)
Where are fire incidents reported in Luna Pier, MI
Something went wrong! Please refresh the page.
|
| |||||||||||||||||||||||||||||||||||||||||||||||||||||||||||||||||||||||||||||||||||||||||||||||||||||||||||||
2002 - 2018 National Fire Incident Reporting System (NFIRS) incidents
- Incident types reported to NFIRS in Luna Pier, MI
- 54753.2%Rescue & EMS
- 14313.9%Hazardous Condition
- 12512.1%Fire
- 12211.9%False Alarm
- 414.0%Service Call
- 292.8%Good Intent Call
- 181.7%Severe Weather
- 30.3%Special Incident
- Fire incident types reported to NFIRS in Luna Pier, MI
- 5947.2%Structure Fires
- 4233.6%Outside Fires
- 1814.4%Mobile Property/Vehicle Fires
- 64.8%Other
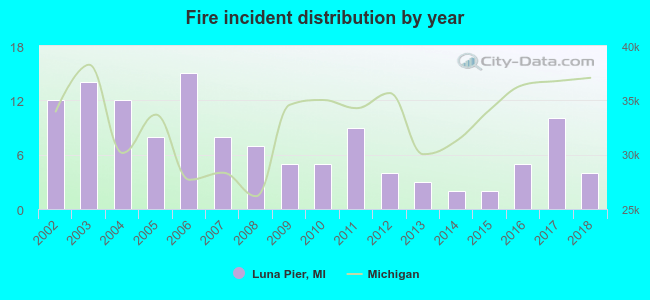 According to the data from the years 2002 - 2018 the average number of fires per year is 7. The highest number of fires - 15 took place in 2006, and the least - 2 in 2014. The data has a dropping trend.
 29.6% incidents where reported in the morning and 70.4% in the evening. The most fires (24.0%) took place on Monday, and the least (8.8%) on Saturday.
 Based on the 125 reports from years 2002 - 2018 most fires (14.4%) took place during June, and the least (4.8%) in November.
 Out of all 1,029 cases reported during the years 2002 - 2018, the most belonged to the categories: Rescue & EMS (53.2%), Hazardous Condition (13.9%), and Fire (12.1%).
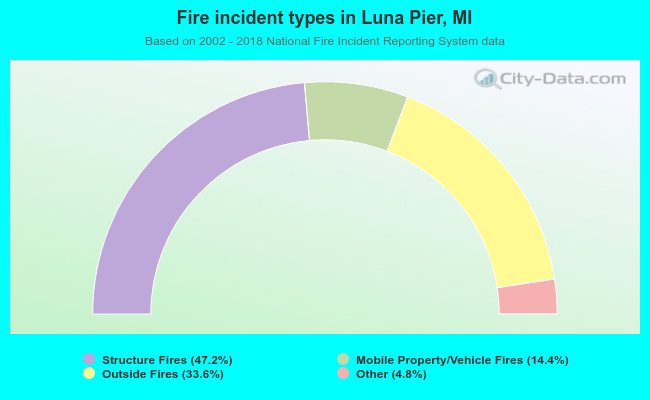 When looking into fire subcategories, the most reports belonged to: Structure Fires (47.2%), and Outside Fires (33.6%).