Luck: Fire Incidents, Wisconsin (WI)
Where are fire incidents reported in Luck, WI
Something went wrong! Please refresh the page.
|
| |||||||||||||||||||||||||||||||||||||||||||||||||||||||||||||||||||||||||||||||||||||||||||||||||||||||||||||
2005 - 2018 National Fire Incident Reporting System (NFIRS) incidents
- Incident types reported to NFIRS in Luck, WI
- 17934.3%Fire
- 15429.5%Rescue & EMS
- 9317.8%Hazardous Condition
- 407.7%Good Intent Call
- 407.7%False Alarm
- 71.3%Service Call
- 71.3%Severe Weather
- 20.4%Special Incident
- Fire incident types reported to NFIRS in Luck, WI
- 8648.0%Structure Fires
- 6134.1%Outside Fires
- 2413.4%Mobile Property/Vehicle Fires
- 84.5%Other
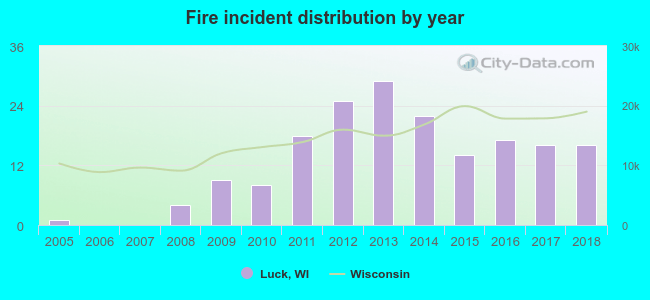 According to the data from the years 2005 - 2018 the average number of fires per year is 13. The highest number of reported fire incidents - 29 took place in 2013, and the least - 0 in 2006. The data has an increasing trend.
 According to the reports from the years 2005 - 2018 the average number of fire-related casualties per year is 1. The highest number of injuries - 3 took place in 2014, and the lowest - 0 in 2005. The data has a constant trend.
 34.1% incidents where reported in the morning and 65.9% in the evening. The most fires (19.0%) took place on Sunday, and the least (10.1%) on Saturday.
 Based on the 179 fire incident reports from years 2005 - 2018 most fires (14.5%) took place during March, and the least (3.9%) in July.
 Out of all 522 cases reported during the years 2005 - 2018, the most belonged to the categories: Fire (34.3%), Overpressure Rupture (29.5%), and Rescue & EMS (17.8%).
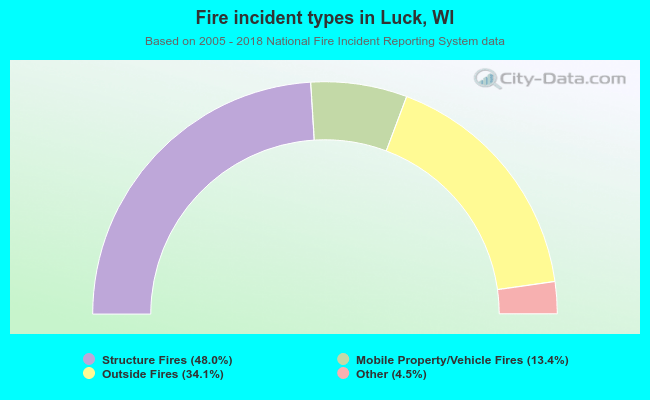 When looking into fire subcategories, the most incidents belonged to: Structure Fires (48.0%), and Outside Fires (34.1%).