Lubbock: Fire Incidents, Texas (TX)
Where are fire incidents reported in Lubbock, TX
Something went wrong! Please refresh the page.
| Fire incidents reported | |
|---|---|
| Sreet name | Count |
| LOOP 289 LOOP | 562 |
| 50TH ST | 442 |
| 19TH ST | 378 |
| INTERSTATE 27 HWY | 346 |
| 4TH ST | 318 |
| UNIVERSITY AVE | 292 |
| SLIDE RD | 250 |
| 34TH ST | 248 |
| MARSHA SHARP FWY | 226 |
| 82ND ST | 198 |
| 46TH ST | 196 |
| 35TH ST | 190 |
| 14TH ST | 182 |
| 45TH ST | 164 |
| 38TH ST | 162 |
| 33RD ST | 158 |
| 26TH ST | 156 |
| 58TH ST | 156 |
| 37TH ST | 152 |
| 39TH ST | 146 |
| 28TH ST | 142 |
| 47TH ST | 142 |
| 66TH ST | 142 |
| 42ND ST | 138 |
| 44TH ST | 138 |
| 22ND ST | 136 |
| 24TH ST | 136 |
| 54TH ST | 136 |
| 23RD ST | 132 |
| AVENUE Q AVE | 132 |
| Other | 3,751 |
2004 - 2018 National Fire Incident Reporting System (NFIRS) incidents
- Incident types reported to NFIRS in Lubbock, TX
- 67,10860.2%Rescue & EMS
- 11,83210.6%Good Intent Call
- 10,0479.0%Fire
- 8,3847.5%Hazardous Condition
- 7,9667.2%False Alarm
- 5,9505.3%Service Call
- Fire incident types reported to NFIRS in Lubbock, TX
- 5,04250.2%Outside Fires
- 3,65736.4%Structure Fires
- 1,30413.0%Mobile Property/Vehicle Fires
- 440.4%Other
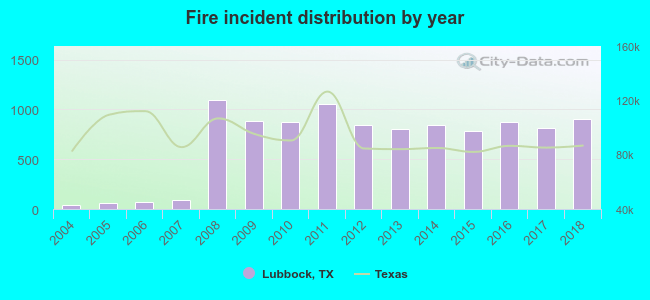 According to the data from the years 2004 - 2018 the average number of fire incidents per year is 669. The highest number of reported fires - 1,091 took place in 2008, and the least - 36 in 2004. The data has a rising trend.
The average number of yearly fire incidents per 10k residents in Lubbock, TX compared to nearest cities:
(Note: Based on data for the last 3 years, including only cities with population 5,000 and above)
| Lubbock: | 35.6 |
| Slaton: | 57.1 |
| Levelland: | 85.5 |
| Brownfield: | 72.7 |
| Littlefield: | 125.1 |
| Plainview: | 59.5 |
| Lamesa: | 108.8 |
| Seminole: | 2.8 |
| Snyder: | 47.5 |
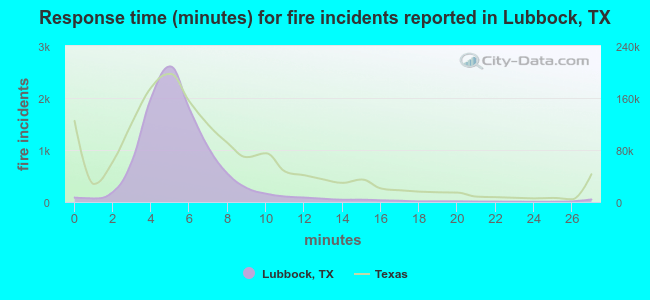 The median response time based on all reported fire incidents is 5 minutes. This is lower than the state median value.
The median response time in Lubbock, TX compared to nearest cities:
(Note: Based on data for all years, including only cities with at least 500 fire incidents)
| Lubbock: | 5 minutes |
| Shallowater: | 10 minutes |
| Slaton: | 5 minutes |
| Levelland: | 7 minutes |
| Brownfield: | 6 minutes |
| Littlefield: | 9 minutes |
| Plainview: | 5 minutes |
| Lamesa: | 6 minutes |
| Muleshoe: | 12 minutes |
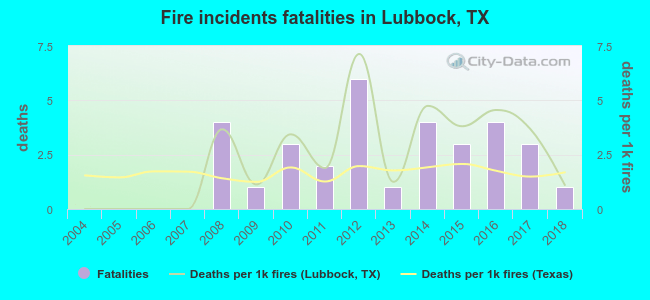 According to the data from the years 2004 - 2018 the average number of fire-related fatalities per year is 2. The highest number of reported deaths - 6 took place in 2012, and the lowest - 0 in 2004. The data has an increasing trend.
The average number of deaths per 1,000 fire incidents is 2. This indicator was the highest - 7 in 2012, and the lowest 0 in 2004. The trend for deaths per 1,000 fire incidents is growing. Compared to the Texas value the number of fatalities per 1,000 fires is higher.
According to the data from the years 2004 - 2018 the average number of fire-related fatalities per year is 2. The highest number of reported deaths - 6 took place in 2012, and the lowest - 0 in 2004. The data has an increasing trend.
The average number of deaths per 1,000 fire incidents is 2. This indicator was the highest - 7 in 2012, and the lowest 0 in 2004. The trend for deaths per 1,000 fire incidents is growing. Compared to the Texas value the number of fatalities per 1,000 fires is higher.Deaths per 1,000 incidents in Lubbock, TX compared to nearest cities:
(Note: Based on data for all years, including only cities with at least 2,500 fire incidents)
| Lubbock: | 3.2 |
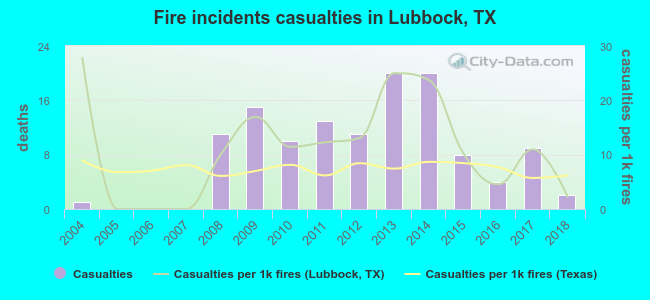 According to the data from the years 2004 - 2018 the average number of fire-related casualties per year is 8. The highest number of injuries - 20 took place in 2013, and the lowest - 0 in 2005. The data has an increasing trend.
The average number of casualties per 1,000 fires is 11. This indicator was the highest - 28 in 2004, and the lowest 0 in 2005. The trend for casualties per 1,000 fire incidents is decreasing. Compared to the Texas value the number of injuries per 1,000 fire incidents is higher.
According to the data from the years 2004 - 2018 the average number of fire-related casualties per year is 8. The highest number of injuries - 20 took place in 2013, and the lowest - 0 in 2005. The data has an increasing trend.
The average number of casualties per 1,000 fires is 11. This indicator was the highest - 28 in 2004, and the lowest 0 in 2005. The trend for casualties per 1,000 fire incidents is decreasing. Compared to the Texas value the number of injuries per 1,000 fire incidents is higher.Casualties per 1,000 incidents in Lubbock, TX compared to nearest cities:
(Note: Based on data for all years, including only cities with at least 500 fire incidents)
| Lubbock: | 12.3 |
| Shallowater: | 5.8 |
| Slaton: | 0.0 |
| Levelland: | 4.6 |
| Brownfield: | 1.9 |
| Littlefield: | 1.6 |
| Plainview: | 14.0 |
| Lamesa: | 5.9 |
| Muleshoe: | 0.0 |
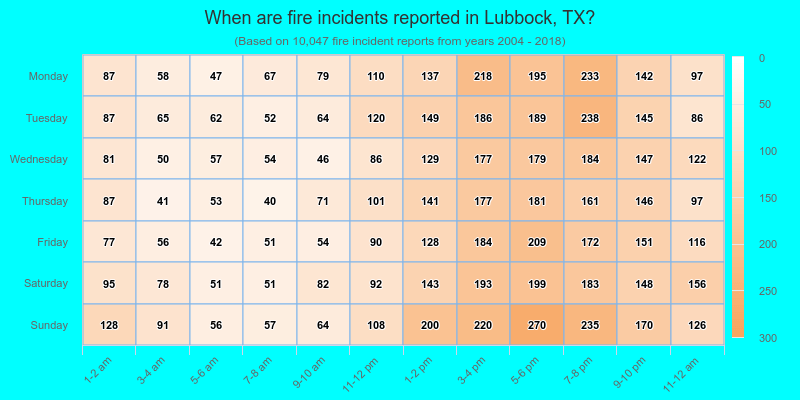
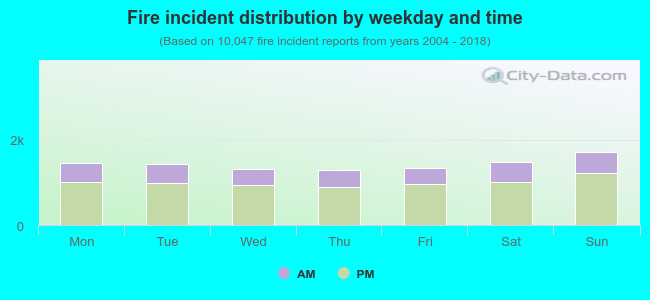 29.7% incidents where reported in the morning and 70.3% in the evening. The most fires (17.2%) took place on Sunday, and the least (12.9%) on Thursday.
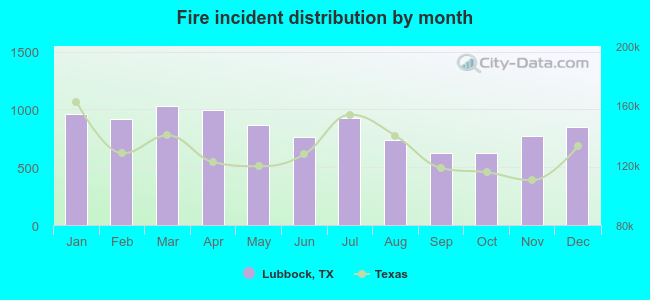 According to the 10,047 fire incident reports from years 2004 - 2018 most fires (10.3%) took place during March, and the least (6.2%) in October.
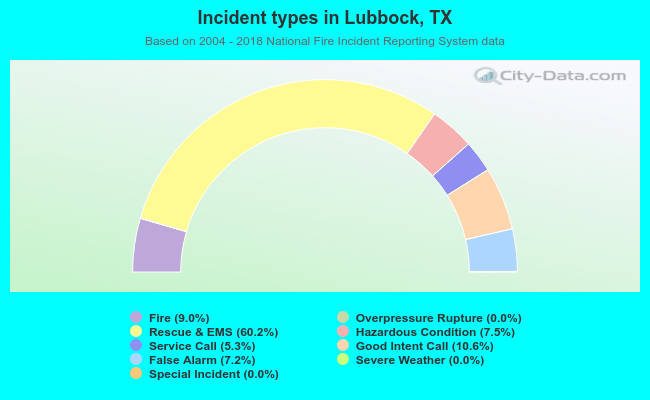 Out of all 111,399 cases reported during the years 2004 - 2018, the most belonged to the categories: Rescue & EMS (60.2%), Good Intent Call (10.6%), and Fire (9.0%).
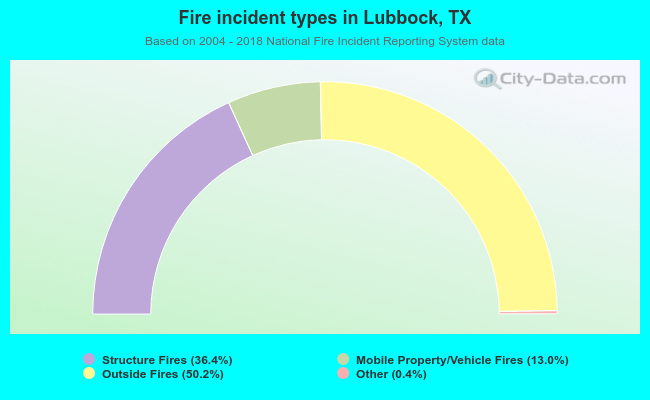 When looking into fire subcategories, the most incidents belonged to: Outside Fires (50.2%), and Structure Fires (36.4%).