Lovington: Fire Incidents, Illinois (IL)
Where are fire incidents reported in Lovington, IL
Something went wrong! Please refresh the page.
|
| |||||||||||||||||||||||||||||||||||||||||||||||||||||||||||||||||||||||||||||||||||||||||||||||||||||||||||||
2002 - 2018 National Fire Incident Reporting System (NFIRS) incidents
- Incident types reported to NFIRS in Lovington, IL
- 12946.9%Fire
- 5319.3%Rescue & EMS
- 3813.8%Hazardous Condition
- 3613.1%Good Intent Call
- 93.3%False Alarm
- 72.5%Service Call
- 20.7%Severe Weather
- 10.4%Special Incident
- Fire incident types reported to NFIRS in Lovington, IL
- 5441.9%Outside Fires
- 4837.2%Structure Fires
- 1713.2%Mobile Property/Vehicle Fires
- 107.8%Other
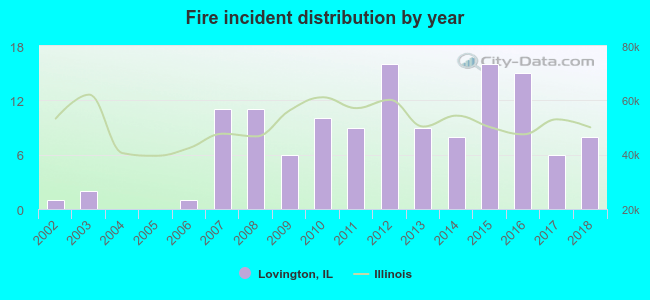 According to the data from the years 2002 - 2018 the average number of fire incidents per year is 8. The highest number of fires - 16 took place in 2012, and the least - 0 in 2004. The data has a growing trend.
 34.1% incidents where reported in the morning and 65.9% in the evening. The most fires (17.1%) took place on Wednesday, and the least (11.6%) on Friday.
 Based on the 129 incident reports from years 2002 - 2018 most fires (13.2%) took place during October, and the least (3.9%) in February.
 Out of all 275 cases reported during the years 2002 - 2018, the most belonged to the categories: Fire (46.9%), Overpressure Rupture (19.3%), and Rescue & EMS (13.8%).
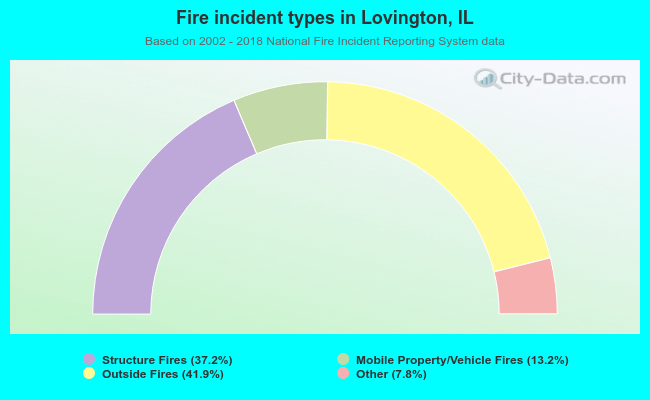 When looking into fire subcategories, the most incidents belonged to: Outside Fires (41.9%), and Structure Fires (37.2%).