Louisville: Fire Incidents, Illinois (IL)
Where are fire incidents reported in Louisville, IL
Something went wrong! Please refresh the page.
|
| |||||||||||||||||||||||||||||||||||||||||||||||||||||||||||||||||||||||||||||||||||||||||||||||||||||||||||||
2006 - 2018 National Fire Incident Reporting System (NFIRS) incidents
- Incident types reported to NFIRS in Louisville, IL
- 68264.8%Rescue & EMS
- 30529.0%Fire
- 343.2%Good Intent Call
- 181.7%False Alarm
- 90.9%Service Call
- 30.3%Hazardous Condition
- Fire incident types reported to NFIRS in Louisville, IL
- 15450.5%Outside Fires
- 9330.5%Structure Fires
- 4916.1%Mobile Property/Vehicle Fires
- 93.0%Other
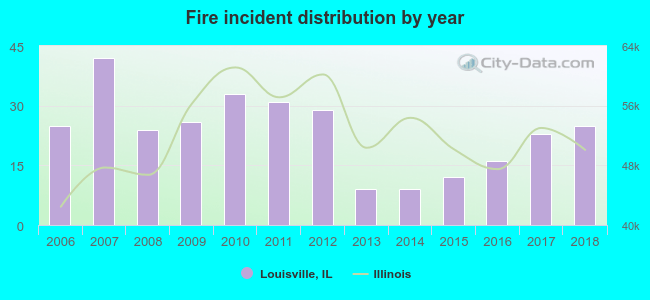 According to the data from the years 2006 - 2018 the average number of fire incidents per year is 23. The highest number of fires - 42 took place in 2007, and the least - 9 in 2013. The data has a constant trend.
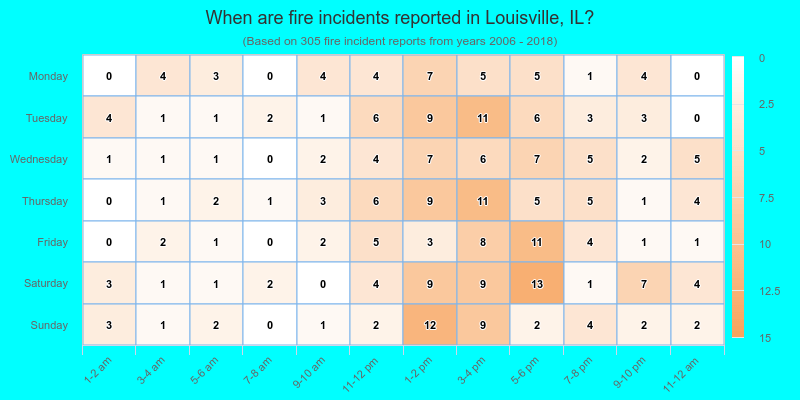
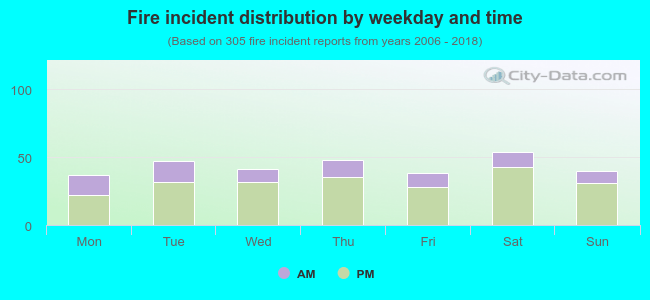 26.9% incidents where reported in the morning and 73.1% in the evening. The most fires (17.7%) took place on Saturday, and the least (12.1%) on Monday.
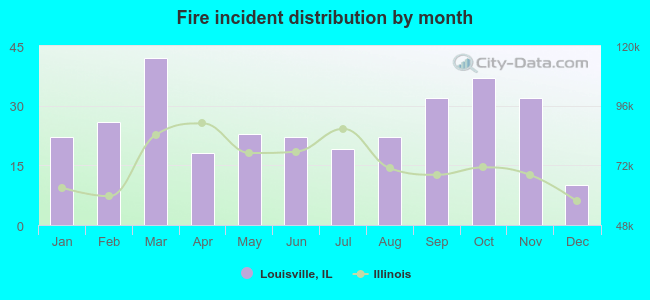 According to the 305 fire incidents from years 2006 - 2018 most fires (13.8%) took place during March, and the least (3.3%) in December.
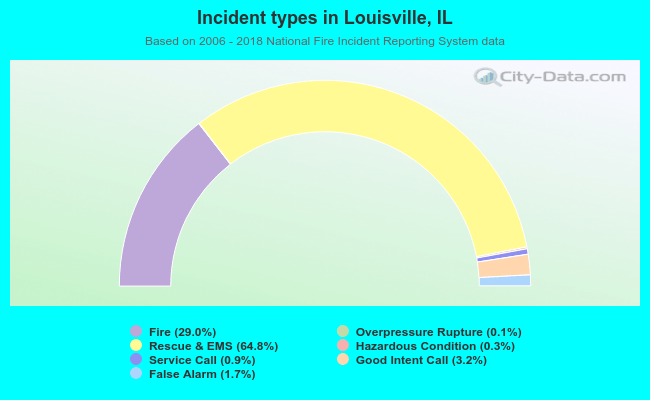 Out of all 1,052 cases reported during the years 2006 - 2018, the most belonged to the categories: Rescue & EMS (64.8%), Fire (29.0%), and Good Intent Call (3.2%).
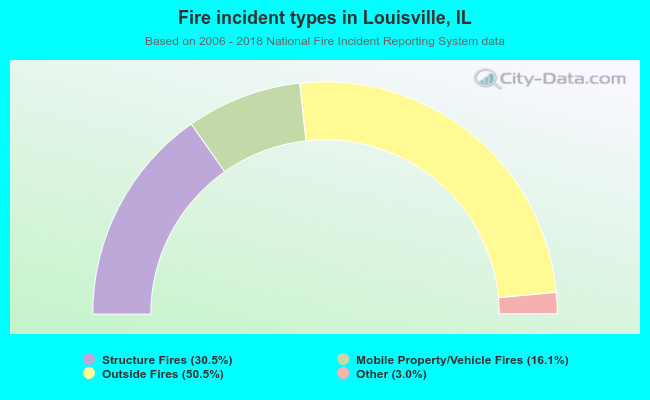 When looking into fire subcategories, the most reports belonged to: Outside Fires (50.5%), and Structure Fires (30.5%).