| Fire incidents reported |
|---|
| Sreet name | Count |
|---|
| 51 HWY | 30 | | COUNTY ROAD 9 | 30 | | HWY 130 | 30 | | COUNTY 27 RD | 25 | | MAIN ST | 25 | | COUNTY 44 RD | 20 | | COUNTY 9 RD | 20 | | COUNTY ROAD 27 | 20 | | COUNTY ROAD 27 RD | 20 | | HIGHWAY 130 HWY | 20 | | WEST ST | 20 | | BAXTER STATION ROAD | 15 | | COUNTY 17 RD | 15 | | HIGHWAY 130 | 15 | | HWY 131 | 15 | | SHIPMAN QUARTERS RD | 15 | | COUNTY ROAD 19 | 14 | | HWY 51 SOUTH | 14 | | 130 BLUE SPRINGS ROAD | 10 | | 130 HWY | 10 | | 44 COUNTY RD | 10 | | BEASELY QUARTERS RD | 10 | | CARAWAY RD | 10 | | COUNTY ROAD 20 RD | 10 | | COUNTY ROAD 44 | 10 |
| | | Fire incidents reported |
|---|
| Sreet name | Count |
|---|
| EUFAULA ST | 10 | | HOBDY STATION ROAD | 10 | | HWY 51 HWY | 10 | | MAIN STREET | 10 | | COUNTY ROAD 33 | 9 | | HWY 51 | 9 | | IKE CIRCLE | 9 | | CO RD 44 | 8 | | CO RD 9 | 8 | | 106 VICTORIA STREET | 5 | | 1100 COUNTY ROAD 27 | 5 | | 1151 CR 31 | 5 | | 131 HWY | 5 | | 1429 CR 33 | 5 | | 144 GERALD TEW ROAD | 5 | | 1525 COUNTY ROAD 20 | 5 | | 1968 MAIN STREET | 5 | | 2549 HWY 51 SOUTH | 5 | | 26 SPIVEY DRIVE | 5 | | 3206 HWY 51 SOUTH | 5 | | 35 MCGILVARY RD | 5 | | 380 CR 33 | 5 | | 46 SHIPMAN QUARTERS ROAD | 5 | | 51 SOUTH HWY | 5 | | 9 COUNTY RD | 5 |
|
 According to the data from the years 2003 - 2018 the average number of fire incidents per year is 15. The highest number of reported fires - 45 took place in 2006, and the least - 1 in 2011. The data has an increasing trend.
 33.5% incidents where reported in the morning and 66.5% in the evening. The most fires (16.9%) took place on Tuesday, and the least (10.7%) on Thursday.
 Based on the 242 reports from years 2003 - 2018 most fires (13.6%) took place during June, and the least (5.0%) in September.
 Out of all 289 cases reported during the years 2003 - 2018, the most belonged to the categories: Fire (83.7%), Overpressure Rupture (8.0%), and Good Intent Call (3.8%).
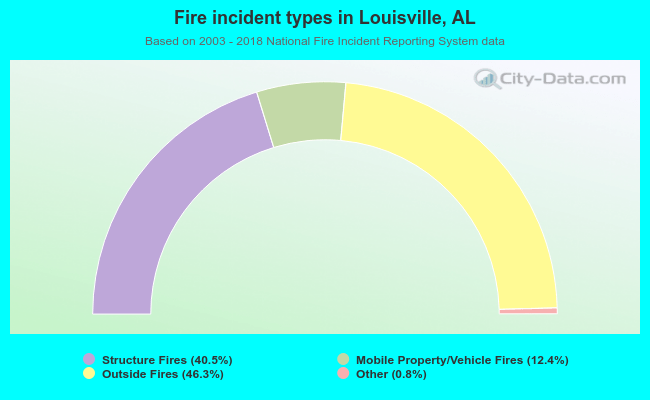 When looking into fire subcategories, the most reports belonged to: Outside Fires (46.3%), and Structure Fires (40.5%).